Risk-Taking and Redistricting’s Effects on Electoral Competition

The study finds that if mapmakers target risk-averse incumbents, they can encourage those incumbents to retire and potentially create a more competitive seat.

Previous research has focused either on partisan effects (Which party “won” the 1980s round of redistricting?) or on aggregate trends (Do more incumbents retire after redistricting?). Our study builds on the extant research by looking at specifically which members of Congress are more likely to retire when presented with unfavorable redistricting, and posits a causal mechanism behind this effect. By examining redistricting in the 1990s, 2000s, and the most recent round leading up to the 2010 election, test whether there are systematic differences in how incumbents react to the uncertainty created by redistricting.

Specifically, we look at “risk-taking” incumbents vs. those who are “risk-averse.” We identify this propensity for risk in two ways: members of Congress who originally ran for office by challenging an incumbent rather than running for an open seat, and those who originally ran for office in a district where voters are predominantly members of the opposing party ( > 57% votes for the opposing party’s presidential candidate). Members of Congress who originally ran for office under one of these two conditions have a greater tolerance for risk than those who ran when there was an open seat or a safe partisan district.

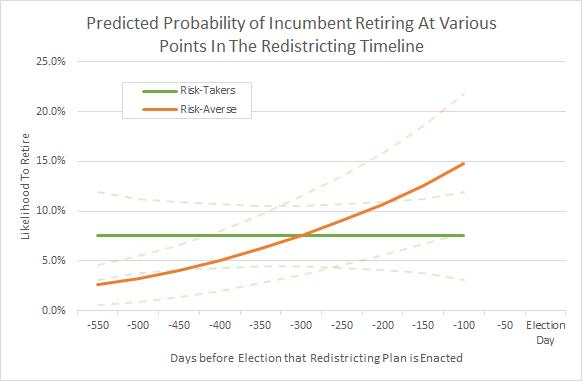
In the paper, currently being prepared for submission to a peer-reviewed journal, we look at a couple different facets of redistricting generated uncertainty.  As seen in Figure 1, the first is the redistricting “timeline”, or how early the plan is adopted before the election. If incumbents respond poorly to uncertainty, we’d expect to see more retirements when plans are adopted late in the cycle. We find that risk-takers are unaffected by when the plan is adopted, while their risk-averse counterparts are more likely to retire when the plan is adopted late in the cycle.

chart3

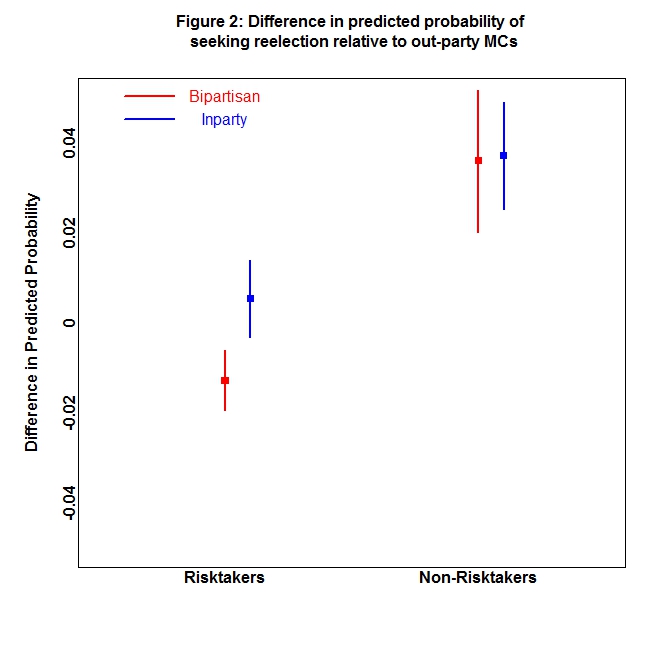
We also compare the type of redistricting plan – was this plan a friendly one (“in-party”), a hostile one (“out-party”), or an incumbent protection plan (“bi-partisan”)? And how do risk-takers differ from those who are risk-averse in reacting to partisan plans? Figure 2 presents the difference between the two favorable types of redistricting and out-party redistricting. The values are calculated by subtracting the probability of retirement in bipartisan/in-party plans and out-party plans. As we can see, the likelihood of retirement between the different types of plans is statistically indistinguishable for risk-takers, but non-risk-takers are significantly more likely to retire when they face a hostile redistricting plan (“out-party”) compared to either of the two more favorable types.

chart4

By looking beyond aggregate trends and looking at characteristics of individual members of Congress, we confirm that politicians do not react to redistricting and uncertainty in the same way. Those who have previously shown a propensity to take risks are less responsive to manipulations by partisan mapmakers, and are less affected by uncertainty than their risk-averse counterparts. These individual characteristics help give us a greater understanding of exactly how partisan mapmakers can affect the decision-making process of incumbent members of Congress, and give us greater insight into how redistricting affects choice in democracy.

What’s in a frame?

A new study conducted by Haystaq Fellow and Assistant Professor of Political Science at the University of Mary Washington Chad Murphy finds that Democrats in Congress are actually more negative about “Obamacare” than their Republican counterparts, while both parties view “healthcare” much more positively.

Derek Willis at The Upshot recently published an article about the decline in the use of the word “Obamacare” in congressional news releases, arguing that it seems to be “shrinking as a political issue.” He finds that this summer, members of Congress only used the word “Obamacare” 138 times this summer compared to 530 times during the same time period last year. He also noted on Twitter that Democrats are much more likely to use the phrase “Affordable Care Act” than “Obamacare” by a 16:1 margin. Does this gap in language between the two parties matter?

Many news organizations and polling firms have shown differences in survey responses depending on what people call the act, and there was of course Jimmy Kimmel’s take on this issue. But there is surprisingly little research into how politicians frame the healthcare law. So to answer this question, we used the Capitol Words API to download all congressional speeches in the most recent Congress. We then used DW-NOMINATE scores to rank the members in terms of ideology and divide them into five quintiles (most liberal, liberal, moderate, conservative, and most conservative). Finally, we applied the HiDEx model to analyze the sentiment of each of these groups for “Obamacare” and “healthcare.” Our results were surprising.

Chart2

In the graph, positive numbers represent positive sentiment toward the concept, while negative numbers represent negative sentiment. As the figure shows, when Democrats use the frame “Obamacare” they are actually more negative than Republicans, with the second most liberal quintile being the most negative about the word.

This doesn’t mean that Democrats are more negative toward the “Affordable Care Act,” instead it means that Democrats have potentially internalized the negativity of the frame, while Republicans are potentially more likely to use “Obamacare” as a colloquial title with less emotion attached to the word itself. While they label it “Obamacare” less frequently than their Republican counterparts, they do so more negatively, which would possibly help explain why the term has such power in public discourse. Democratic members of Congress dislike “Obamacare” even as they’re more likely to support the “Affordable Care Act”.

Women in the House

Most of the research on women’s representation looks at the types of policies Congress passes, and whether women vote for more “pro-women” policies than their male counterparts. Academic research on this topic is mixed, with some scholars finding overall differences between women and men in Congress, others finding differences on specific issues, and others finding no difference at all between the two groups. While this has been a hot topic in political science for several decades, we still don’t have a definitive answer for whether men and women represent their constituents differently.

This research typically relies on roll call votes – that is to say whether women are more likely to vote “yes” on legislation that men vote “no” on. Roll call data have a number of limitations, and just because they are the easiest data to access doesn’t mean they are the right data. To answer this unresolved question, we looked in a different place: speeches.

Speeches, specifically Senate floor speeches, give us better leverage on the question for  three reasons.

  1. They can be on any topic the Senator chooses
  2. They can be measured on virtually infinite dimensions rather than a forced “yes/no” dichotomy
  3. Politicians speak far more than they vote, giving us bigger data

By looking at all Senate floor speeches in the 112th Congress (2011-2012), and comparing men and women in a high-dimensional model of word co-occurrence called HiDEx, we were able to compute a “semantic differential” score for a number of different words representing women’s issues. We found a few significant differences between men and women.

chart1

We present our findings in the figure, and the full working paper is available on Academia.edu. We show that women were more likely to describe other women and healthcare positively than men were, while they were more likely to describe guns negatively. They were also more likely to describe abortion as being about “choice” than “life.” But most strikingly, women linked other more closely to “work” rather than “home.” This shows a fundamental difference in worldviews between men and women, and a fundamental difference in how the different genders view the role of women in the modern world. These findings hold even when controlling for partisanship.

By applying a novel analysis to an old question we were not only able to help bring new evidence to a debate in the academic literature, but we were able to learn more about the differences between men and women than we would have if we only looked where everyone else was looking. Finding a new dataset and applying a more sophisticated, high-dimensional analysis gives us the advantage and shows differences that weren’t otherwise apparent.


VA-7: Is David Brat Squandering his Opportunity?

I’m fortunate enough to live in the 7th Congressional District of Virginia, so I’m right in the middle of all the coverage of one of the biggest stories in domestic politics right now. One of the big stories has been the silence of David Brat for almost a week (as of the time I write this post) after his win. The nation was focused on him and his district, and it was a great chance for him to introduce himself to potential voters. But still we’ve heard nothing from the Republican nominee.

The recent work in political science argues that even presidents are unable to move public opinion through making speeches, and this has begun to infiltrate media accounts of presidential power as well.* However, what we haven’t been able to examine is the counterfactual to a president speaking. We’ve been missing the proverbial “dog that didn’t bark.” We now have a great example of this, as we see the Republican nominee avoiding media attention after his upset victory. David Brat’s lack of public presence in VA-07 after winning the primary shows us exactly the costs of failing to speak and failing to be prepared. Nowhere is this more evident than on reporter Parker Slaybaugh’s Facebook feed where he posted:

I have tried for 2 days now to speak with Dave Brat after his victory over Eric Cantor and he and his campaign have told me he is not speaking at all publicly until maybe Monday. They say they are bring on more staff to help out. What do you think? Do you think he should have spoken to his constituents and to the media by now? Let me know in the comments below!

 While clearly looks like the Facebook equivalent of a push poll, many of the commenters agreed strongly with the premise of this post. Cantor had been voted out in part because of his failure to connect with the district, so Brat’s initial post-victory silence may have soured voters against him. While media appearances might not have helped his standing in the district, failing to appear certainly seems to be hurting him, at least in the short-term.

This is a great example of where randomized experiments, the type preferred by political scientists and considered the gold standard in the academic literature on campaigns, can’t help us understand politics. No candidate is going to let us randomly decide whether he will be available to the press after the campaign, nor is any president. But we don’t want to let the availability of experiments limit the types of questions we can answer and what we can learn about politics. So we have to look for natural experiments, where a candidate is “assigned” to a treatment condition through factors outside his control. Brat’s unexpected win is a great example of a candidate being caught unprepared and forced to react, and offers us a great chance to learn the costs of a candidate not going public.


Chad Murphy

Fellow – HaystaqDNA

Assistant Professor of Political Science – University of Mary Washington


——————————

*For a counterpoint to this line of work, see my work with former student Annie Morris showing that presidents are able to change the behavior of members of Congress.

Cantor Threats Were Evident

I have been a resident of VA-07 since the 2010 round of redistricting, so I’ve experienced a couple of Congressman Cantor’s campaigns firsthand. Back in 2012, Cantor barely campaigned. The campaign was so low-key that several of my neighbors still displayed “Wittman for Congress” signs in their yards , presumably leftover from 2010, as they were unaware that we were redrawn into Cantor’s district. These are people passionate enough about voting that they kept yard signs in their garages for at least two years and then put them back out in 2012, but, presumably, they didn’t know they were represented by Eric Cantor until they got to the polling place. It would have been easy to miss− other than a couple of negative postcards about his opponent, there didn’t seem to be much of a campaign at all.

Fast-forward to 2014 and we saw a flood of TV ads describing David Brat as a “liberal college professor” and “advisor to Tim Kaine” (both of which are claims of dubious truthfulness). We saw ads that looked like a negative ad from Barack Obama against Eric Cantor, describing the latter as someone who wouldn’t compromise and would stick to his conservative values. But more telling was the fact that interest groups were getting involved in the campaign on behalf of Cantor. According to a tweet from Derek Willis, reporter for the NY Times Upshot, “The $308k American Chemistry Council spent on ad backing Eric Cantor is 29x all other IEs in his district since 2006 combined.” They were running TV spots as frequently, if not more frequently, than the Congressman himself.  These ads were polished, well-done, and professional. Clearly someone had spent a lot of money on these ads, but why?

According to the internal polls his campaign released, Cantor was up by 34 points. This made sense to much of the media because everyone expected him to win easily, so no one gave it any more thought. Something didn’t add up though. If Cantor was winning by 34 points, why would he be spending so much money in the primary? Why would the American Chemistry Council be spending so much of their money to help a candidate who was clearly going to win? Why not devote their resources elsewhere? The answer was simple: because everyone involved with the campaign knew that the poll was wrong and that David Brat posed a real threat to the incumbent’s position.  As I posted back on May 22, Cantor was worried about being outflanked by the Tea Party.

We know that candidates always project an optimistic front, strategically releasing internal polls for a variety of reasons unrelated to sharing true predictions.  So you can’t rely on their words to know what they’re thinking, you can only rely on their actions to signal how they truly see their chances. If they are running more ads than normal, they think they are losing. If those ads are negative, they think they are losing. Even acknowledging the opponent is a signal that candidates see that opponent as a viable challenge. Cantor’s campaign definitely did that through the deluge of ads both by the campaign and the American Chemistry Council. The signals were there, you just had to know where to look.


Chad Murphy

Fellow – HaystaqDNA

Assistant Professor, Political Science – University of Mary Washington