Haystaq – Abortion Impact on State Legislatures 10/11/2022


Expanding Democrat’s Holdings in State Legislatures by Leveraging Abortion

Download a PDF of this Report

This white paper takes advantage of Haystaq’s national issue scores to identify expansion targets for the Democratic Party in state legislative elections.[1] Based on feedback we have received, we focused on the following chambers in bold that we believe are pick up opportunities when using abortion related messaging. This analysis considers all seats being contested by the two major parties, excluding only those rated as “Solid D” by CNalysis (whose seat ratings this paper adopts).

Expansion Targets 2022[2]

Protects 2022 Cycle

Long-term Opportunities

Michigan House

Nevada House, and Senate

Georgia House only

Pennsylvania House

Maine Senate

North Carolina House

Arizona Senate

Minnesota House

North Carolina Senate

Michigan Senate


The table below briefly summarizes the legal status of abortion in the targeted states and public option in the state overall. It is quite possible that abortion may prove to be a more salient issue in states where the current abortion policy is at odds with the opinion of the majority of voters.

State

Legal

Constitutional Protection

Legislative Control

% supporting Abortion Statewide

Abortion Rights Under Threat

Arizona

No (pending court challenges)

No

GOP

56%

Yes

Pennsylvania

Yes

No

GOP

56%

Yes[3]

Minnesota

Yes

Yes (non-explicit)

Split

54%

No

Michigan

Yes (pending court action)

No

GOP

55%

No

Nevada

Yes

Yes

Dem

63%

No

Maine

Yes

No

Dem

62%

No

North Carolina

Yes (viability)

No

GOP

49%

Yes

Georgia

Yes (6-weeks)

No

GOP

49%

Yes

Texas

No

No

GOP

46%

Yes

The key finding is, given that the vast majority of Americans disapprove of the overturning of Roe versus Wade, there are several dozen GOP held state legislative seats with pro-choice majorities and where Haystaq’s data can be used to id and target pro-choice voters, and there are many more seats where vulnerable Democrats can use the abortion issue to bolster their electoral position. If Democrats succeed in unifying the pro-choice vote, the party could gain control over both houses of the Michigan legislature along with the Pennsylvania House and the Arizona Senate. Of these legislative chambers, the Michigan Senate will be the easiest to flip, followed by the PA House and AZ Senate.[4] Evidence from field testing and from recent special elections shows that this issue indeed moves vote choice.

The tables below highlight seats in each legislative chamber where abortion related messaging can make a difference with expansion opportunity seats in bold and districts ranked by the salience of the abortion issue. The race ratings key below is taken from CNalysis. For each chamber, the number of seats currently held by the GOP which have Pro Choice majorities is noted, and the information is underlined when the number of seats is enough to flip control of the chamber to the Democrats.

Race Ratings Key

Solid R

Very Likely R

Likely R

Lean R

Tilt R

Tossup

Tilt D

Lean D

Likely D

Very Likely  D

Expansion Targets

MI Senate (Chamber Rating: toss-up)

  • 3 flips possible
  • 3 seats need for control

District With CN Analysis Rating

Current Hold

Reg Voters

Likely Voters

Count Pro Choice

Count Pro Choice Likely Voters

Percent Pro Choice

13

D

203,108

96,391

124,993

59,925

62.2%

21

R

198,356

72,090

124,412

42,377

58.8%

4

D

209,569

71,730

121,671

41,947

58.5%

14

R

201,075

82,691

109,008

47,801

57.8%

28

R

181,207

74,818

104,858

42,582

56.9%

9

D

185,843

75,889

102,357

40,839

53.8%

11

D

198,566

64,910

108,308

33,591

51.8%

PA House (Chamber Rating likely R)

  • 15 flips identified
  • 12 seats needed for control

District With CN Analysis Rating

Current Hold

Reg Voters

Likely Voters

Count Pro Choice

Count Pro Choice Likely Voters

Percent Pro Choice

172

D

33,927

10,996

22,451

7,861

71.5%

45

D

43,874

15,931

27,537

10,751

67.5%

121

D

31,109

9,160

19,974

6,054

66.1%

25

D

42,922

15,281

25,405

9,733

63.7%

16

D

40,813

14,148

21,510

8,880

62.8%

118

D

42,605

17,678

23,913

11,075

62.6%

33

R

42,033

17,389

22,957

10,729

61.7%

2

D

40,142

15,108

22,620

9,219

61.0%

151

R

45,408

20,190

25,941

12,161

60.2%

61

D

45,892

22,495

25,552

12,769

56.8%

29

R

49,874

24,003

26,528

13,555

56.5%

137

R

44,561

15,873

23,385

8,956

56.4%

189

R

37,397

8,393

20,618

4,691

55.9%

53

D

40,307

14,872

22,866

8,240

55.4%

115

D

37,081

8,163

20,666

4,517

55.3%

39

R

44,855

17,716

21,461

9,763

55.1%

146

D

41,054

12,209

22,100

6,662

54.6%

30

R

44,426

20,948

22,894

11,429

54.6%

168

R

42,387

19,484

22,816

10,466

53.7%

3

D

44,772

19,822

22,179

10,629

53.6%

26

R

42,572

16,872

22,166

9,037

53.6%

142

R

43,865

17,959

22,188

9,544

53.1%

18

R

39,719

12,975

22,449

6,835

52.7%

51

R

38,160

12,060

16,212

6,323

52.4%

144

R

45,006

18,380

22,831

9,625

52.4%

74

D

37,401

10,581

18,538

5,449

51.5%

82

R

37,986

13,096

20,020

6,678

51.0%

120

R

39,922

15,036

18,435

7,586

50.5%

AZ Senate (Chamber Rating: Very Likely R)

  • 3 flips possible
  • 2 seats needed for control

District With CN Analysis Rating

Current Hold

Reg Voters

Likely Voters

Count Pro Choice

Count Pro Choice Likely Voters

Percent Pro Choice

11

R

112,243

21,923

79,713

16,064

73.3%

18

D

158,642

75,347

111,147

48,576

64.5%

8

R

128,059

36,355

87,767

21,919

60.3%

23

R

120,100

24,701

68,004

12,805

51.8%

MI House (Chamber Rating: lean R)

  • 8 flips possible
  • 3 seats needed to gain control

bgcolor=”blue”

District With CN Analysis Rating

Current Hold

Reg Voters

Likely Voters

Count Pro Choice

Count Pro Choice Likely Voters

Percent Pro Choice

20

D

74,703

33,317

44,633

21,164

63.5%

2

D

65,447

18,182

40,242

10,875

59.8%

21

D

58,957

28,645

36,086

16,881

58.9%

40

D

67,752

30,234

41,519

17,688

58.5%

69

D

72,560

22,945

41,253

13,418

58.5%

22

D

74,522

38,574

42,596

21,876

56.7%

73

R

55,292

23,075

31,876

13,015

56.4%

80

R

66,445

27,813

38,367

15,675

56.4%

81

R

68,707

30,413

38,364

16,737

55.0%

27

D

71,170

27,671

38,741

15,117

54.6%

31

D

72,470

25,464

38,074

13,908

54.6%

55

D

66,620

31,869

38,131

17,284

54.2%

28

D

69,534

22,056

36,538

11,800

53.5%

83

R

59,140

14,944

36,566

7,973

53.4%

54

D

69,211

32,757

40,086

17,424

53.2%

84

R

66,713

23,496

38,486

12,497

53.2%

57

R

63,492

19,714

31,956

10,376

52.6%

58

R

65,522

21,407

34,247

11,175

52.2%

48

R

73,170

35,774

36,904

18,598

52.0%

61

D

71,308

24,653

38,596

12,660

51.4%

76

D

70,433

29,252

37,021

14,962

51.1%

68

D

73,016

26,474

39,197

13,513

51.0%

Protects

NV House (Chamber Rating: Lean D)

  • 1 flip possible

District With CN Analysis Rating

Current Hold

Reg Voters

Likely Voters

Count Pro Choice

Count Pro Choice Likely Voters

Percent Pro Choice

42

D

44,553

12,768

25,434

7,464

58.5%

8

D

45,109

11,885

24,845

6,932

58.3%

1

D

51,497

17,487

28,641

10,081

57.6%

16

D

44,548

11,222

26,180

6,403

57.1%

9

D

45,980

14,436

24,380

7,992

55.4%

34

D

46,428

14,224

26,023

7,855

55.2%

41

D

49,126

15,291

26,150

8,440

55.2%

35

D

49,196

15,937

25,225

8,609

54.0%

5

D

46,656

15,138

25,280

8,115

53.6%

29

D

47,750

15,236

25,112

8,103

53.2%

3

D

43,360

12,115

24,085

6,425

53.0%

25

R

49,102

25,773

25,767

13,467

52.3%

21

D

49,808

18,523

25,623

9,670

52.2%

12

D

43,998

13,569

24,805

6,950

51.2%

NV Senate (Chamber Rating: Very Likely D)

  • 0 flips possible
  • None of the districts up for election this cycle have a majority of voters that are pro-choice, the below districts are analyzed based on registered rather than likely voters

District With CN Analysis Rating

Current Hold

Reg Voters

Count Pro Choice

Percent Pro Choice

8

D

96,819

48,480

50%

9

D

90,550

49,824

55%

12

R

98,969

51,790

52.3%

ME Senate (Chamber Rating: Toss-Up)

  • 0 flips possible
  • GOP needs nine seats to gain control

District With CN Analysis Rating

Current Hold

Reg Voters

Likely Voters

Count Pro Choice

Count Pro Choice Likely Voters

Percent Pro Choice

21

D

25,931

7,124

17,802

4,036

56.7%

32

D

26,344

8,889

14,976

4,884

54.9%

31

D

28,733

9,933

15,916

5,400

54.4%

34

D

31,246

12,996

15,178

6,576

50.6%

MN House (Tilt R)

  • 0 flips possible
  • GOP needs four seats to gain control

District With CN Analysis Rating

Current Hold

Reg Voters

Likely Voters

Count Pro Choice

Count Pro Choice Likely Voters

Percent Pro Choice

53B

D

25,309

7,593

16,415

4,114

54.2%

Long Term Opportunities

NC House (Chamber Rating: Very Likely R)

  • 8 flips possible
  • 18 seats needed for control

District With CN Analysis Rating

Current Hold

Reg Voters

Likely Voters

Count Pro Choice

Count Pro Choice Likely Voters

Percent Pro Choice

50

D

59,865

27,811

38,018

19,911

71.6%

54

D

61,270

30,619

38,775

21,297

69.6%

36

D

61,463

25,334

39,993

17,206

67.9%

40

D

65,822

31,750

41,228

20,272

63.8%

2

R

59,451

25,007

34,722

15,938

63.7%

115

D

60,045

24,852

35,735

15,817

63.6%

47

D

47,726

11,876

25,628

7,539

63.5%

35

D

60,762

24,066

37,173

15,226

63.3%

48

D

48,841

13,585

28,474

8,535

62.8%

45

R

47,078

12,215

28,417

7,652

62.6%

105

D

56,324

20,484

35,701

12,659

61.8%

98

R

60,543

22,631

34,947

13,450

59.4%

104

D

59,160

27,187

35,184

16,127

59.3%

9

D

55,901

19,298

32,233

11,185

58.0%

103

D

60,482

26,478

35,050

15,210

57.4%

62

R

64,967

28,217

38,258

16,097

57.0%

32

D

52,567

17,380

29,592

9,815

56.5%

37

R

61,579

23,314

33,283

12,959

55.6%

73

R

51,777

17,394

27,506

9,460

54.4%

43

R

52,756

16,831

27,273

8,767

52.1%

74

R

62,114

26,190

32,873

13,619

52.0%

20

R

62,597

24,229

30,376

12,350

51.0%

24

D

54,889

18,154

28,798

9,097

50.1%

NC Senate (Chamber Rating: Very Likely R)

  • 2 flips possible
  • 4 seats need for control

District With CN Analysis Rating

Current Hold

Reg Voters

Likely Voters

Count Pro Choice

Count Pro Choice Likely Voters

Percent Pro Choice

17

D

136,972

53,338

81,240

32,867

61.6%

24

R

115,536

30,281

63,238

18,564

61.3%

18

D

135,437

53,694

79,153

32,830

61.1%

19

D

128,229

37,142

76,536

22,350

60.2%

42

R

143,920

59,588

87,923

35,736

60.0%

3

D

136,151

47,483

69,517

24,703

52.0%

GA House (Chamber Rating: Very Likely R)

  • 1 flip possible
  • 14 seats needed for control

District With CN Analysis Rating

Current Hold

Reg Voters

Likely Voters

Count Pro Choice

Count Pro Choice Likely Voters

Percent Pro Choice

54

D

38,541

14,555

28,391

9,010

61.9%

106

D

39,923

15,464

22,184

8,580

55.5%

50

D

36,503

13,086

23,946

7,105

54.3%

101

D

38,378

12,387

21,243

6,550

52.9%

35

R

37,535

11,982

19,972

6,280

52.4%

154

D

40,566

14,684

25,057

7,670

52.2%

105

D

38,221

12,695

20,704

6,582

51.8%

TX House (Chamber Rating: Very Likely R)

  • 2 flips possible
  • 10 seats needed for control

District With CN Analysis Rating

Current Hold

Reg Voters

Likely Voters

Count Pro Choice

Count Pro Choice Likely Voters

Percent Pro Choice

35

D

72,311.00

12,898.00

62,774.00

10,016.00

77.7%

41

D

97,046.00

24,425.00

81,649.00

17,763.00

72.7%

74

D

109,198.00

25,412.00

87,426.00

17,676.00

69.6%

47

D

129,733.00

70,610.00

83,307.00

43,880.00

62.1%

135

D

99,870.00

25,133.00

66,184.00

15,587.00

62.0%

37

D

96,832.00

23,604.00

75,297.00

14,532.00

61.6%

148

D

89,635.00

22,825.00

59,411.00

13,594.00

59.6%

45

D

121,123.00

43,602.00

74,356.00

24,199.00

55.5%

105

D

75,258.00

20,157.00

50,794.00

11,005.00

54.6%

34

D

103,130.00

24,252.00

46,370.00

12,661.00

52.2%

118

R

113,023.00

29,691.00

70,522.00

15,032.00

50.6%

31

R

111,130.00

35,801.00

71,456.00

18,112.00

50.6%

Works Cited

“Abortion in Nevada.” Wikipedia, 3 Aug. 2022, en.wikipedia.org/wiki/Abortion_in_Nevada#History. Accessed 9 Aug. 2022.

“Arizona Senate.” Wikipedia, 25 July 2022, en.wikipedia.org/wiki/Arizona_Senate. Accessed 9 Aug. 2022.

“Arizona State Legislative.” Projects.cnalysis.com, projects.cnalysis.com/21-22/state-legislative/arizona. Accessed 9 Aug. 2022.

Center for Reproductive Rights. “Abortion Laws by State.” Center for Reproductive Rights, reproductiverights.org/maps/abortion-laws-by-state/.

Cohn, Nate. “Do Americans Support Abortion Rights? Depends on the State.” The New York Times, 4 May 2022, www.nytimes.com/2022/05/04/upshot/polling-abortion-states.html.

“Georgia House of Representatives.” Wikipedia, 16 June 2022, en.wikipedia.org/wiki/Georgia_House_of_Representatives. Accessed 16 Aug. 2022.

“Maine State Legislative.” Projects.cnalysis.com, projects.cnalysis.com/21-22/state-legislative/maine. Accessed 9 Aug. 2022.

“Michigan Senate.” Wikipedia, 18 May 2022, en.wikipedia.org/wiki/Michigan_Senate. Accessed 9 Aug. 2022.

“Minnesota House of Representatives.” Wikipedia, 24 Mar. 2022, en.wikipedia.org/wiki/Minnesota_House_of_Representatives. Accessed 9 Aug. 2022.

“Minnesota State Legislative.” Projects.cnalysis.com, projects.cnalysis.com/21-22/state-legislative/minnesota. Accessed 9 Aug. 2022.

“Nevada Assembly.” Wikipedia, 7 June 2021, en.wikipedia.org/wiki/Nevada_Assembly.

“Nevada State Legislative.” Projects.cnalysis.com, projects.cnalysis.com/21-22/state-legislative/nevada. Accessed 9 Aug. 2022.

“North Carolina House of Representatives.” Wikipedia, 1 Aug. 2022, en.wikipedia.org/wiki/North_Carolina_House_of_Representatives. Accessed 16 Aug. 2022.

“North Carolina Senate.” Wikipedia, 8 Oct. 2020, en.wikipedia.org/wiki/North_Carolina_Senate.

“North Carolina State Legislative.” Projects.cnalysis.com, projects.cnalysis.com/21-22/state-legislative/north-carolina. Accessed 16 Aug. 2022.

“Pennsylvania House of Representatives.” Wikipedia, 30 July 2022, en.wikipedia.org/wiki/Pennsylvania_House_of_Representatives. Accessed 9 Aug. 2022.

“Pennsylvania State Legislative.” Projects.cnalysis.com, projects.cnalysis.com/21-22/state-legislative/pennsylvania. Accessed 9 Aug. 2022.

Wikipedia Contributors. “Michigan House of Representatives.” Wikipedia, Wikimedia Foundation, 31 Oct. 2019, en.wikipedia.org/wiki/Michigan_House_of_Representatives. Accessed 7 Nov. 2019.

—. “Texas House of Representatives.” Wikipedia, Wikimedia Foundation, 25 Nov. 2019, en.wikipedia.org/wiki/Texas_House_of_Representatives.


[1] In Wyoming and Oklahoma Democrats are not contesting enough seats to take control of the legislature. In West Virginia, the Dakotas, Tenensee, Kentucky, Indiana, and Utah not enough Democratic candidates filed to take control of the upper houses of the legislature. In Massachusetts the GOP is not contesting either house of the legislature and in California the GOP is not contesting the state senate.

[2] The AZ house was not analyzed because CNalysis does not rate these races.

[3] Both houses of the PA leg. are controlled by anti-abortion forces and GOP gubernational nominee Doug Mastriano supports a total ban on abortion

[4] The Michigan house will be difficult to flip because the Dems need to play defense in several challenging seats.

Report on Racial Bloc Voting Analysis for the State of Montana 10/03/2022


Report on Racial Bloc Voting Analysis for the State of Montana

Prepared for: 

The Montana  Districting and Apportionment Commission

Download a PDF of this Report

May 6, 2022


Synopsis

Analysis of the State of Montana’s election results going back to 2014 shows evidence of racial bloc voting (RBV) in the five regions solicited by the Montana Districting and Apportionment Commission. This analysis used general and party primary elections for ten races going back to 2014. We show the results of Homogeneous Precinct Analysis, Bivariate Regression Analysis, and Ecological Inference Analysis to support these findings. All analyses were run using two definitions of American Indian, “American Indian Any” and “American Indian Alone”, using Citizen Voting Age Population (CVAP) data. In the following report, we will walk you through our findings. 

Introduction

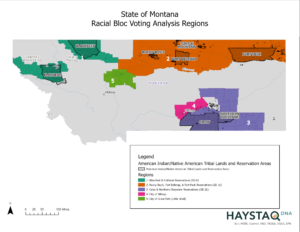
Figure 1: Map of the 5 regions for analysis defined by the MT Redistricting and Apportionment Commission

Since 2004, Montana’s legislative maps have included 6 majority-minority House Districts (out of 100 districts total) and 3 majority-minority Senate Districts (out of 50 districts total).  These majority-minority House and Senate Districts cover all or part of 7 reservations in Montana, which guided our RBV analysis.  In addition to the three regions spelled out below that surround current majority-minority legislative districts, the Montana Districting and Apportionment Commission has requested that Haystaq DNA analyze the two major cities with the highest American Indian populations, Great Falls and Billings. 


As of the 2016-2020 American Community Survey 5-year Estimates released by the U.S. Census, Montana has a citizen voting age population statewide that is 6.53% “American Indian Alone” and 8.09% “Any Part American Indian.” For minority demographic groups, it was requested that HaystaqDNA look at citizen voting age populations for “Any Part American Indian,” as well as “American Indian Alone” to determine if racially polarized voting exists and to what extent amongst those two categories.  

Regions

HaystaqDNA performed the analysis on five regions in the State of Montana to determine if there was RBV in past elections.  Our analysis includes all precincts within 17 counties, broken down into the following five regions at the request of the Redistricting Commission.  While regions 1 through 3 were selected because they encompass current majority-minority House and Senate Districts, it was proposed that our analysis include all precincts within the 17 counties listed below to ensure coverage of precincts both on and off reservation lands and both within and outside of current majority-minority legislative districts. 


Region 1 – Blackfeet & Flathead Reservations (SD 8) 

Reservation Senate District House District County 
Blackfeet  SD 8 HDs 15 & 16 Glacier Co. Precincts 
Blackfeet  SD 8 HD 15 Pondera Co. Precincts
Flathead  SD 8 HD 15 Lake Co. Precincts
Flathead  Sanders Co. Precincts 


 Region 2 – Rocky Boy’s, Fort Belknap, & Fort Peck Reservations (SD 16) 

Reservation Senate District  House District County
Rocky Boy’s SD 16 HD 32 Hill Co. Precincts
Rocky Boy’s SD 16 HD 32 Chouteau Co. Precincts
Fort Belknap SD 16 HD 32 Blaine Co. Precincts
Fort Belknap SD 16 HD 32 Phillips Co. Precincts 
Fort Peck SD 16 HD 31 Roosevelt Co. Precincts
Fort Peck SD 16 HD 31 Valley Co. Precincts
Fort Peck Daniels Co. Precincts 
Fort Peck Sheridan Co. Precincts


Region 3 – Crow & Northern Cheyenne Reservations (SD 21) 

Reservation Senate District House District  County
Crow SD 21 HDs 41 & 42  Big Horn Co. Precincts
Crow SD 21 HD 42  Yellowstone Co. Precincts 42.1 and 

42.2 only (remaining Yellowstone Co. 

Precincts part of Billings Region) 

Crow SD 21 HD 41 Rosebud Co. Precincts 
SD 21 HD 41 Powder River Co. Precincts 


Region 4 – City of Billings   

Reservation Senate District House District  County
Yellowstone County Precincts (excluding Precincts 42.1 and 42.2 which are included in a majority-minority House and Senate District and part of Region 3) 


Region 5 – City of Great Falls (Little Shell) 

Reservation Senate District House District  County
Cascade County Precincts

Elections

The following elections were analyzed using Ecological Inference,  Homogeneous Precinct Analysis and Bivariate Regression Analysis in each of the 5 regions. There were 10 races for analysis total, with 4 from each presidential election cycle and 1 from each midterm between 2014 and 2020. For each of the races listed below, we analyzed the election results from the General, Democratic Primary, and Republican Primary elections where applicable. 


  1. 2014 U.S. Senate 
  2. 2016 President 
  3. 2016 Congressional 
  4. 2016 Governor 
  5. 2016 Attorney General 
  6. 2018 U.S. Senate 
  7. 2020 President 
  8. 2020 U.S. Senate 
  9. 2020 Attorney General 
  10. 2020 Auditor 

Data

Election Results & Precinct Shapefiles

Our process began with creating precinct shapefiles joined to election results for each year of elections, to reflect precinct geographies in place at the time of the election. We obtained the shapefile of Montana Voting Precincts from the Montana State Library Services repository. A shapefile is a geospatial vector data format for geographic information system (GIS) software. We use these shapefiles to spatially analyze the election results in comparison with population data. We obtained historical election results at the precinct level from the Montana Secretary of State website. Using the information below, we manually consolidated election results or precinct geographies. 

Four of the 17 counties included in the region of study have had a precinct change between 2014 and 2020. The following is a list of the Precinct Changes between 2014 and 2020 which were made manually on the 2020 precinct shapefile before running the rest of the analysis. 

Precinct changes between 2014 and 2016

  • Yellowstone County (Region 4 – City of Billings) 

          o Consolidation:  Precincts 40.2 and 45.1 consolidated into Precinct 40-45 

Precinct Changes between 2016 and 2018 

  • Lake County (Region 1 – Flathead Reservation) 

          o Split:  Precinct Pab 1 split from Ron 1 

          o Split:  Precinct Pab 2 split from Ron 2 

*The precinct geography for Ron 1 in 2014 and 2016 was equivalent to the current Pab 1 and Ron 1 combined on the Census Bureau’s 2020 Lake County VTDs.  The precinct geography for Ron 2 in 2014 and 2016 was equivalent to the current Pab 2 and Ron 2 combined on the Census Bureau’s 2020 Lake County VTDs. 

  • Phillips County (Region 2 – Fort Belknap Reservation) 

          o Consolidation:  Precincts 2s, 5, 6, 8s, 11 and 12s consolidated into 11S 

          o Consolidation:  Precincts 2n, 7, 8n, 9-1, 9-2, 12n and 16 consolidated into 11N 


  • Valley County (Region 2 – Fort Peck Reservation) 

          o Consolidation:  Precincts 1 and 2 consolidated into 31 

          o Consolidation:  Precincts 2 and 4 consolidated int 33 

          o Consolidation:  Precincts 5, 6, 7 and 8 consolidated into 34 

Population Data

For the demographic population data, we used Citizen Voting Age Population (CVAP) from the American Community Survey 5-year Estimates released by the U.S. Census. These data are available at the Block Group level. We disaggregated the data from the Block Group level to the Block level, and then aggregated the data to precincts. This same process was followed for every election year, following the manual modifications made to the precinct shapefile reflecting the consolidations and changes made to precinct geography outlined above, to join CVAP from the year of the election to election results.

We performed the analysis using the “American Indian Alone” category, and also on an “Any Part American Indian” category that we created by combining “American Indian Alone”, “American Indian or White” and “American Indian and Black or African American.” We compared these American Indian categories to “White Alone” and “Other”, which is the combination of all remaining variables. 

Methodologies

Homogeneous Precinct Analysis

Homogeneous precinct analysis is a method for estimating voting behavior by race or ethnicity by comparing voting patterns in “homogeneous precincts,” i.e. precincts that are composed of a single racial or ethnic group. 

For example, if there is a precinct composed entirely of American Indian voters, and the voters within that precinct give 90% of their votes to Candidate X, then we know that 90% of the American Indian voters supported Candidate X. Since precincts are usually not exclusively one race or ethnicity, precincts that are 90% or more of a single race or ethnicity are usually considered homogeneous for the purposes of this analysis.

A drawback of homogeneous precinct analysis is that we are only able to perform it in a given region that has homogeneous precincts. For example, if a region does not have any precincts that are over 90% CVAP for the race or ethnicity of interest, we are unable to perform homogeneous precinct analysis. 

For the purposes of our analysis, we define a homogeneous American Indian precinct to be any precinct that is 90% or more American Indian Alone or American Indian Any.

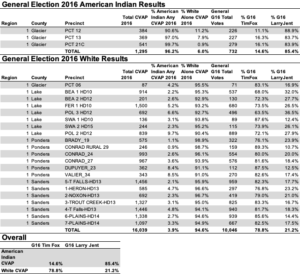
In Figure 2, we have an example of homogeneous precinct analysis from the 2016 General Election for Attorney General in Region 1.

Figure 2: Bivariate regression plot: Attorney General, 2016 General Election, Region 1.

In Figure 2, we see in the first table that in all of Region 1, there are 3 homogeneous American Indian precincts, all in Glacier county. We see in the Total row that these precincts are overall 96.2% American Indian Any, and the vast majority of voters, 85.4%, voted for Larry Jent. In the second table, we can see that there are many more homogeneous white precincts in Region 1, and overall they are 94.6% white. The majority of voters in these precincts, 78.8%, voted for Tim Fox. These results show evidence of racial bloc voting in this election and region. 

In the results section, we consider evidence of RBV to be present when we see greater than a 50% preference for the American Indian and White candidate of choice, and when those candidates differ. 

Bivariate Regression Analysis

Bivariate regression analysis provides estimates of voting patterns by race or ethnicity across precincts, regardless of the existence of homogeneous precincts. The analysis shows the relationship between each candidate’s precinct-level vote share and the precinct-level CVAP for each race or ethnicity. 

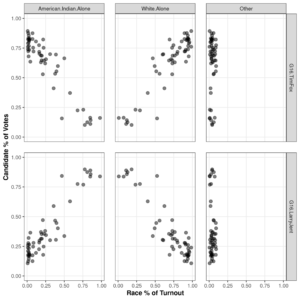
For example, in Figure 3, we can see the plot of % American Indian Alone, White Alone, and Other CVAP in comparison with the % of Votes for Tim Fox and Larry Jent in the 2016 General Election for Attorney General in Region 1.  

Figure 3: Bivariate regression plot: Attorney General, 2016 General Election, Region 1.

In Figure 3, each point represents a precinct and its share of CVAP on the x-axis vs the candidate votes in that precinct on the y-axis. In the top left, we can see as the proportion of American Indian Alone CVAP % increases, the share of votes for Tim Fox decreases. In the bottom right, we can see that as the proportion of American Indian Alone CVAP increases, the share of votes for Larry Jent increases. The inverse is true for the Whie Alone category. For the Other category, the % CVAP is so small that we cannot draw any conclusions. 

In Figure 4, we can see the correlation coefficients for each bivariate relationship shown in Figure 3. 

Figure 4: Bivariate regression correlation coefficients: Attorney General, 2016 General Election, Region 1.

For each plot, a correlation coefficient can be between -1 to 1, where -1 is a perfect negative correlation and 1 is a perfect positive correlation, or slope of the graph if we were to draw a line of best fit on each plot in Figure 3. Here, in Region 1, we see a strong positive correlation between American Indian Alone CVAP and votes for Larry Jent, with a coefficient of 0.9265. We also see a strong positive correlation between White Alone CVAP and votes for Tim Fox in the 2016 Attorney General’s race. These results show evidence of racial bloc voting in this election in Region 1. 

In the results section, we consider evidence of RBV to be present when we see a strong positive correlation of greater than 0.5 for the American Indian and White candidate of choice, and when those candidates differ. 

Ecological Inference Analysis

Ecological Inference (EI) is the process of drawing conclusions about individual-level behavior from aggregate-level data. The process involves using aggregate (historically called “ecological”) data to draw conclusions about individual-level behavior when no individual-level data are available. The fundamental difficulty with such inferences is that many different possible relationships at the individual level can generate the same observation at the aggregate level. For example, there are a very large number of ways in which electoral support for a political candidate can break down among individual voters and still produce the same aggregate level of support. In the absence of individual-level measurement (for example in the form of surveys), such information needs to be inferred.

EI analysis builds on ecological regression analysis by incorporating method of bounds and maximum likelihood estimation statistical techniques. For our analysis, we use the eiCompare package in R, which builds on Gary King’s ei package in R. 

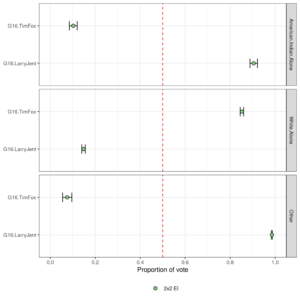
Figure 5 provides an example of EI analysis for the same election as the previous examples, the 2016 Attorney General election in Region 1. 

Figure 5: Ecological Inference Plot: Attorney General, 2016 General Election, Region 1.

In Figure 5, we see the estimates of the EI analysis. The green dots represent the EI estimate, and the lines on either side of the dots represent the confidence interval of the statistical estimate. When looking at the estimates for American Indian Alone in the top box, you can see that the estimate of votes is strongly for Larry Jent. For White CVAP, the preference is for Tim Fox.

Figure 6: Ecological Inference Estimates: Attorney General, 2016 General Election, Region 1.

Figure 6 gives the precise estimates shown in the chart above. In the above example, the predicted support for Larry Jent among American Indian Alone CVAP was 90% and for White CVAP was 14.8%. The predicted support for Tim Fox among White CVAP was 85%. The confidence intervals (ci_95_lower and ci_95_upper) indicate that for this estimate, there is a 95% confidence that the true value of this statistically predicted support for Tim Fox among White CVAP is between 83.75% and 86.63%. These results show evidence of racial bloc voting in this election and region. 

In the results section, we consider evidence of RBV to be present when we see a clear majority preference for both the American Indian and White candidate of choice and when those candidates differ. 

Results

In looking at elections in Montana going back to 2014, we found evidence of racial bloc voting in each of the five regions we analyzed. That is, we found evidence that using either the “American Indian Alone” or the “American Indian Any” definition, American Indian voters vote cohesively in support of their candidate of choice, and that White voters often vote in a bloc for a different candidate of choice. 

Across regions, we only saw a few instances where there was RBV for only one of “American Indian Alone” or “American Indian Any”, but not for both. Overall, the results were very similar between the two definitions of American Indian. 

In the following sections, we provide summary level results of our findings for each Region that we analyzed. We are also providing a Supporting Appendix with the charts for each methodology and definition of American Indian where we found evidence of RBV. 

Region 1 – Blackfeet & Flathead Reservations (SD 8)

Figure 7: Region 1

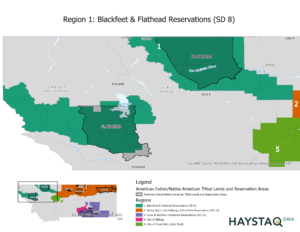
Region 1 consists of all precincts in Glacier, Pondera, Lake, and Sanders counties. Region 1 has a total CVAP of approximately 47,434. The American Indian Alone CVAP is approximately 12,693, or 26.76%, and the American Indian Any CVAP is 14,021, or 29.57% of the total CVAP. 

The examples provided in the methodology show evidence of racial bloc voting in the 2016 General Election for Attorney General. 

In Region 1, the Homogeneous Precinct Analysis, Bivariate Regression Analysis, and Ecological Inference Analysis all showed evidence of RBV in the following elections, using both the American Indian Alone and American Indian Any definitions: 

  • 2014 U.S. Senate, General Election
  • 2016 President, General Election
  • 2016 Congressional, General Election
  • 2016 Attorney General, General Election
  • 2016 Governor, General Election
  • 2018 U.S. Senate, General Election
  • 2020 President, General Election
  • 2020 U.S. Senate, General Election
  • 2020 Attorney General, General Election
  • 2020 Auditor, General Election


In addition, we found evidence of RBV with the following methods and elections: 

  • Homogeneous Precinct Analysis showed RBV in the 2016 Presidential Democratic Primary and the 2020 Attorney General Republican Primary. 
  • Bivariate Regression Analysis showed RBV in the 2014 US Senate Republican Primary and the 2016 Gubernatorial Republican Primary for both American Indian Alone and American Indian Any definitions. 

Our analysis did not find evidence of RBV using Ecological Inference in any primary elections in Region 1.  

Region 2 – Rocky Boy’s, Fort Belknap, & Fort Peck Reservations (SD 16)

Figure 8: Region 2

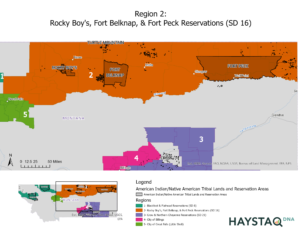
Region 2 consists of all precincts in Hill, Chouteau, Blaine, Phillips, Roosevelt, Valley, Daniels, and Sheridan counties. Region 2 has a total CVAP of approximately 40,957. The American Indian Alone CVAP is approximately 10,590, or 25.9%, and the American Indian Any CVAP is 11,581, or 28.3% of the total CVAP. 

In Region 2, the Homogeneous Precinct Analysis, Bivariate Regression Analysis, and Ecological Inference Analysis all showed evidence of RBV in the following elections, using both the American Indian Alone and American Indian Any definitions: 

  • 2014 U.S. Senate, General Election
  • 2016 President, General Election
  • 2016 Congressional, General Election
  • 2016 Governor, General Election
  • 2016 Attorney General, General Election
  • 2018 U.S. Senate, General Election
  • 2020 President, General Election
  • 2020 U.S. Senate, General Election
  • 2020 Attorney General, General Election
  • 2020 Auditor, General Election
  • 2020 Auditor, Democratic Primary

The 2016 Democratic Primary Election for President showed evidence of RBV using the Homogeneous Precinct Analysis and Ecological Inference Analysis, using both the American Indian Alone and American Indian Any definitions.

Region 3 – Crow & Northern Cheyenne Reservations (SD 21)

Figure 9: Region 3

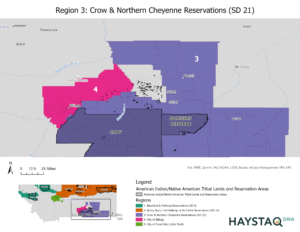
Region 3 consists of all precincts in Big Horn, Rosebud, and Powder River Counties. Region 3 also includes Yellowstone County Precincts 42.1 and 42.2 (remaining Yellowstone County precincts not in the Billings region). Region 3 has a total CVAP of approximately 17,532. The American Indian Alone CVAP is approximately 7,615, or 43.4%, and the American Indian Any CVAP is 8,016, or 45.7% of the total CVAP. 

In Region 3, the Homogeneous Precinct Analysis, Bivariate Regression Analysis, and Ecological Inference Analysis all showed evidence of RBV in the following elections, using both the American Indian Alone and American Indian Any definitions: 

  • 2014 U.S. Senate, General Election
  • 2016 President, General Election
  • 2016 Congressional, General Election
  • 2016 Attorney General, General Election
  • 2016 Governor, General Election
  • 2018 U.S. Senate, General Election
  • 2020 President, General Election
  • 2020 U.S. Senate, General Election
  • 2020 Attorney General, General Election
  • 2020 Auditor, General Election

In addition, we found evidence of RBV with the following methods and elections: 

  • Ecological Inference showed evidence of RBV in the 2020 Attorney General Democratic Primary for both American Indian Alone and American Indian Any definitions. 
  • Bivariate Regression Analysis showed evidence of RBV in the 2016 Presidential Republican Primaries for both American Indian Alone and American Indian Any definitions. 
  • Homogeneous Precinct Analysis showed evidence of RBV in the 2016 Gubernatorial Republican Primary. 

Region 4 – City of Billings

Figure 10: Region 4

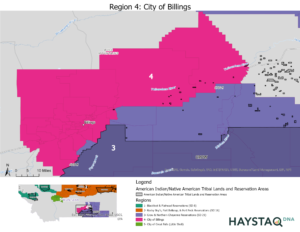
Region 4 consists of all precincts in Yellowstone County, except for precincts 42.1 and 42.2 which are included in Region 3. Region 4 has a total CVAP of approximately 121,688. The American Indian Alone CVAP is approximately 5,484, or 4.5%, and the American Indian Any CVAP is 7,351, or 6% of the total CVAP. 

In Region 4, we were not able to perform Homogeneous Precinct Analysis because there were no homogeneous American Indian Alone or American Indian Any precincts, where the American Indian CVAP was 90% or more of the total CVAP. 

The Bivariate Regression Analysis and Ecological Inference Analysis showed evidence of RBV in the following elections, using both the American Indian Alone and American Indian Any definitions: 

  • 2014 U.S. Senate, General Election
  • 2016 President, General Election
  • 2016 Congressional, General Election
  • 2016 Governor, General Election
  • 2016 Attorney General, General Election
  • 2018 U.S. Senate, General Election
  • 2020 President, General Election
  • 2020 U.S. Senate, General Election
  • 2020 Attorney General, General Election
  • 2020 Auditor, General Election

Additionally, the Ecological Inference alone showed evidence of RBV in the following elections, using both the American Indian Alone and American Indian Any definitions: 

  • 2014 U.S. Senate, Democratic Primary
  • 2016 President, Democratic Primary
  • 2016 Governor, Republican Primary
  • 2018 U.S. Senate, Republican Primary
  • 2020 President, Democratic Primary
  • 2020 Attorney General, Democratic Primary
  • 2020 Attorney General, Republican Primary 
  • 2020 Auditor, Democratic Primary

Using only the American Indian Alone definition, the Ecological Inference showed RBV in the following elections as well: 

  • 2014 U.S. Senate, Republican Primary
  • 2020 Auditor, Republican Primary

Using only the American Indian Any definition, the Ecological Inference showed RBV in the following election as well: 

  • 2016 President, Republican Primary

The Bivariate Regression also shows RBV in the 2020 U.S. Senate Republican Primary for American Indian Alone and American Indian Any. 

Region 5 – City of Great Falls (Little Shell)

Figure 11: Region 5

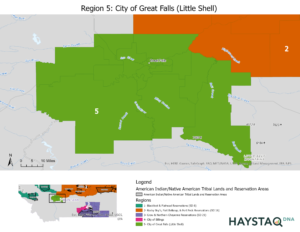
Region 5 consists of all precincts in Cascade County. Region 5 has a total CVAP of approximately 63,032. The American Indian Alone CVAP is approximately 3,434, or 5.5%, and the American Indian Any CVAP is 4,697, or 7.5% of the total CVAP. 

In Region 5, we were not able to perform Homogeneous Precinct Analysis because there were no homogeneous American Indian Alone or American Indian Any precincts, where the American Indian CVAP was 90% or more of the total CVAP. 

The Ecological Inference Analysis showed evidence of RBV in the following elections, using both the American Indian Alone and American Indian Any definitions: 

  • 2014 U.S. Senate, General Election
  • 2016 President, General Election
  • 2016 Congressional, General Election
  • 2016 Attorney General, General Election
  • 2018 U.S. Senate, General Election
  • 2020 President, General Election
  • 2020 U.S. Senate, General Election
  • 2020 Attorney General, General Election
  • 2020 Attorney General, Democratic Primary
  • 2020 Auditor, General Election
  • 2020 Auditor, Democratic Primary

Additionally, the Ecological Inference showed evidence of RBV in the 2016 Presidential Democratic Primary using American Indian Alone only. 

Supporting Appendices

Attached to this report is a folder of Supporting Appendices that has the following structure: 

Supporting Appendices

        Bivariate Regression and Ecological Inference Analysis – this folder contains all charts as shown in the methodology section for these analysis, where we found evidence of RBV. The charts are broken out by Region

                    Region 1

                             Files ending in ‘Bivariate Plot’ and ‘Bivariate Coefficients’ show the results of the Bivariate Regression Analysis. 

                            Files ending in ‘EI Plot’ and ‘EI Estimates’ show the results of the Ecological Inference Analysis

                           G stands for General Election, DemP stands for Democratic Primary, RepP stands for Republican Primary in the file names.

                          AI stands for American Indian in the file names. 

                   Region 2

                   Region 3

                   Region 4

                   Region 5

                        Homogeneous Precinct Analysis – this folder contains data files (in CSV format) of the results of the homogeneous precinct analysis for all regions that had precincts that were 90% or more American Indian Any/Alone or White. 

                        G stands for General Election, DemP stands for Democratic Primary, RepP stands for Republican Primary in the file names.

                        AI stands for American Indian in the file names.