Modern presidential campaigns need to contact voters at high volume and on a sensitive timeline; to encourage persuadable voters to support them, to solicit donations, to engage volunteers, and to ensure that supportive voters turn out at the polls. Targeting each message to the most receptive audience is central to succeeding at all of these functions, not only because campaign resources are scarce, but also because contacting unsympathetic voters can produce harmful backlash. Bernie Sanders ran for the Democratic nomination for president in 2016 with little name recognition, little money, and little support. With HaystaqDNA’s help, the Sanders campaign attracted the support of almost half of Democratic voters and a substantial share of convention delegates, and Bernie Sanders was able to bring his message to a national audience.
Microtargeting and predictive analytics has been a cornerstone of modern campaigns at the presidential level ever since our CEO and founder, Ken Strasma pioneered the approach on John Kerry’s 2004 Democratic primary campaign. While the Democratic National Committee now offers some basic models for the use of Democratic campaigns, the Sanders campaign engaged Haystaq so that it could take advantage of state-of-the-art candidate- and state-specific modeling, data-informed delegate maximization strategies, and experimental design guidance. Haystaq’s models were used for a wide variety of applications, including targeted deployment of distributed volunteer calls, addressable television and digital advertising, segmentation of fundraising email lists, turnout tracking, and field program optimization.
1. Sanders Support Models
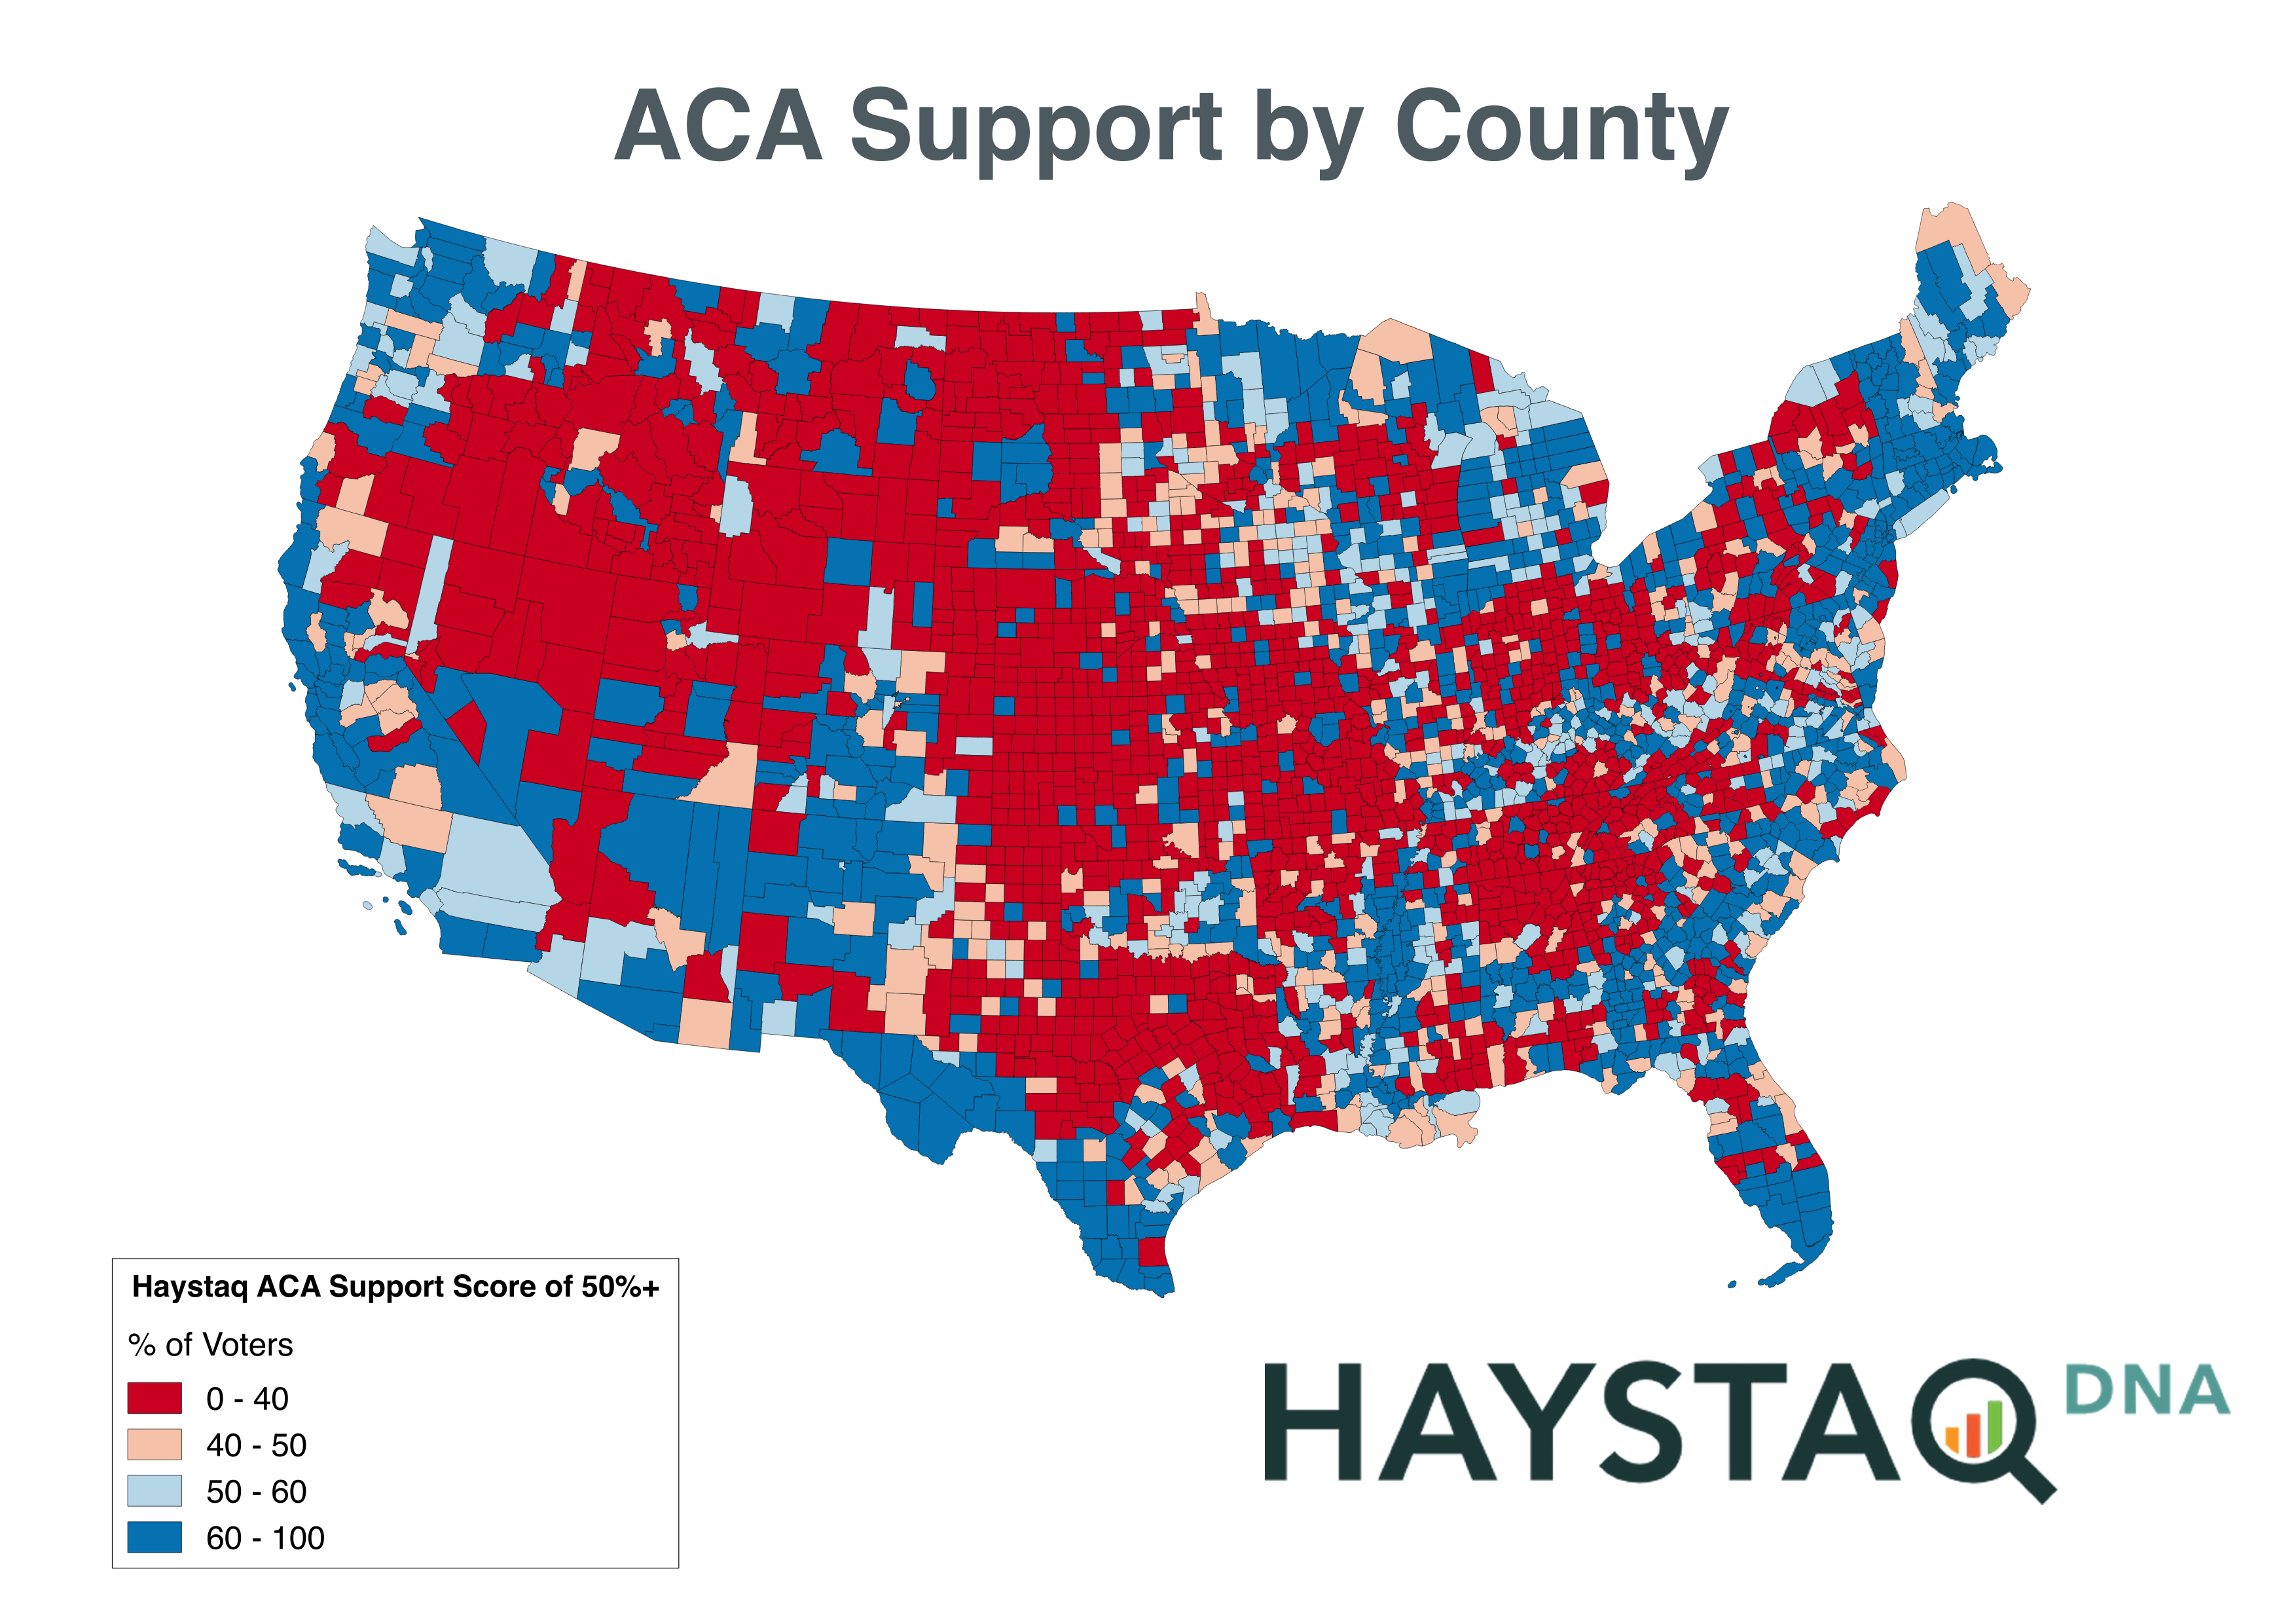
Using survey data combined with advanced statistical and machine learning modeling techniques, Haystaq created state-specific models predicting the extent to which any of a sample of eligible Democratic primary voters surveyed could be expected to support Bernie Sanders for president over Hillary Clinton. Once a state’s support model was validated and optimized using a test-set of survey records, it was applied to all eligible Democratic primary voters in a state, assigning each a probability score predicting the likelihood of that voter supporting Bernie Sanders. To ensure the models remained up-to-date and were incorporating all available data, they were regularly refreshed to include new data from our daily tracking surveys, and new data collected by the campaign’s field program.
In some states, Haystaq also created specific support models for hard-to-reach demographic groups such as African Americans and Hispanics. Those groups of voters were often scored low on our support models, but it was important to the campaign to expand its appeal among minority voters, so these models allowed the campaign to find which African-American voters, for example, were relatively more likely to be open to Sanders. These were used for specific outreach to those groups, to maximize persuasive impact while minimizing the risks of contacting unsupportive voters.
2. Primary Turnout Models
Using a similar process, Haystaq also created scores predicting each individual voter’s likelihood of participating in the Democratic primary. Primary elections typically draw significantly lower participation than generals; they are often open only to registered partisans and even then, only the most engaged activist voters tend to participate. In some states, like Iowa, which is always first on the primary calendar, delegates are chosen not in a regular election but a caucus. Since participating in these contests can require voters to stay at their caucus location for up to several hours, participation is extremely low. (In 2008, the year of the last contested primary on the Democratic side, Iowa caucus participation was a record high at 239,000.)
To create turnout models for such unusual contests requires a state-specific approach, and is a challenge because there can be no direct source for a 2016 turnout dependent variable before the election has taken place. The methodology we have honed defines the most recent similar election as a model. Then we “roll back” date-based indicators like age and past election voting history in order to create a model “predicting” 2008 primary turnout using only what was known before 2008, once this model is validated (that is, we verify that it tracked 2008 participation accurately), we “roll forward” the indicator set, to apply it to 2016 voters.
This is the most valid method available, but it is flawed in that it assumes repetition of past voting patterns, and no turnout model can be validated until the election is over. The outputs of turnout models generally need to be artificially adjusted to account for expected changes in voting patterns. This was especially true in this case since we were relying on participation patterns of 2008, which could not be expected to be repeated in part because of the different groups of voters motivated by Bernie Sanders versus Barack Obama, and differences in the reception to Hillary Clinton in 2008 versus 2016. In the case of the Sanders campaign, we knew that our supporters were much less likely than Clinton supporters to have participated in the 2008 primaries, and less likely to be registered as Democrats, and so they would be rated as less likely to participate under the traditional metrics. For this reason, we also modeled voters’ “self-reported” turnout likelihood using responses to a survey question about intent to vote. Our studies have shown that people generally exaggerate their likelihood of voting when asked, but that a self-reported turnout score does work well as a relative measure. The self-reported models allowed us to account for the increased enthusiasm felt by the many Sanders supporters who were first-time primary voters.
3. Campaign Engagement and Other Models
Among the other models Haystaq created for the campaign were volunteer, email-responsiveness, and fundraising models, each of which were based upon individuals’ direct engagement with the campaign. Using the voter records of people who volunteered with the campaign’s field team, canvassing or phone-banking to reach voters, we created scores to find people who had not volunteered with the campaign, but who were most likely to respond favorably if asked. These models allowed the campaign to more efficiently recruit the volunteers who were critical to its field program.
Similarly, we created “look-alike” models to help the campaign find the people most likely to donate, including multiple versions of this model to approximate the expected value of an individual’s donation. In this way, we helped the campaign to maximize their record-breaking small-donor fundraising success, and to expand the program from email-only to targeted digital ads.
4. Delegate Strategy
Because the delegates that ultimately decided the nomination were, in many states, awarded according to congressional district (or by precinct in IA), the campaign needed to work to optimize delegates rather than total votes. Delegates are often awarded in small integers in proportion to district-level vote totals, so there are specific times where gaining or losing a small number of votes can make the difference of a delegate. Using our support and turnout models, we were able to predict which districts were likely to be divided close to these points and recommend that the campaign direct its resources there. The simplest example of this is that in a district with an odd number of delegates, the winning candidate gets an extra delegate no matter how small the margin; whereas in a district with an even number of delegates, 50% of the vote plus 1 is worth dramatically less effort, since the candidates will split the delegates evenly unless one wins by a much larger margin.
5. Election Day turnout tracking
Haystaq also managed the campaign’s election day turnout tracking operation, which involved crowdsourcing reports of how many ballots had been cast at particular precincts at various times on election day and aggregating those reports upward to project voting trends. Precincts were categorized according to the average support score of eligible primary voters as favorable to Clinton or Sanders. Our turnout tracking system compared the actual number of ballots cast at base Sanders and Clinton precincts to the baseline expectation during the day to give the campaign an indication of whether it was likely to win the state, and then perhaps more importantly, how delegates apportioned at district levels were likely to be distributed. This allowed the campaign to direct its resources to the places where additional campaign phone calls or canvassing were most likely to make a difference in the delegate total.
6. Fundraising Models
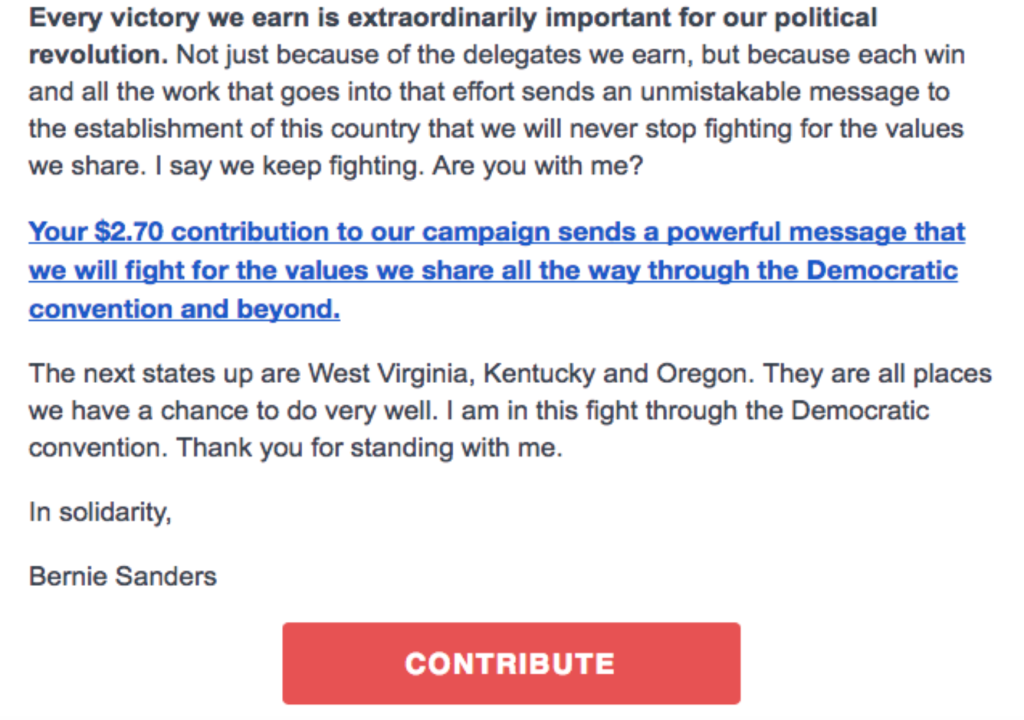
Haystaq and the campaign also conducted a series of experiments aimed at optimizing the response to its fundraising emails by varying the “ask amount” referenced in the email text. In general, asking for larger donations does yield larger donations, but asking for smaller donations yields more donations. We found in a series of A/B tests conducted in early April that asking people who had not previously contributed to the campaign for $2.70 (1/10 the campaign’s oft-cited average contribution of $27) consistently produced a higher expected return than the campaign’s original practice of asking for $3. While the average donation amount decreased marginally with the smaller ask, this effect was moderated by the fact that people often donated more than the amount asked for once they reached the donation page.
7. Direct mail
Haystaq microtargeting models allowed for the creation of nuanced and very precisely targeted direct mail universes. We were able to increase the volume of mail sent to precincts or congressional districts where our modeling showed that the campaign was near the tipping point for winning additional delegates, and also to target specific messages to voters most likely to be sympathetic. Using a suite of more than 50 issues ranging from climate change to school choice support, we were able to direct messaging on climate change, for example, to the voters most likely to strongly agree with Sanders’ climate message. We were also able to direct additional mail to individuals with low television viewing or low social media usage scores, improving reach among voters unlikely to see the campaign’s messaging in other media.
8. Television Targeting
Microtargeting is often thought of as a tool only for direct voter contact like phones, door knocking or direct mail. However, given the share of resources spent on television advertising, this may be the most important application of microtargeting. Haystaq used ratings data by various different demographic and lifestyle indicators to calculate the likelihood of any individual voter watching a particular show, network or daypart. We then overlaid this data with our modeled lists of persuadable voters and likely supporters to calculate the cost of reaching any one of the campaign’s targets via television. This often led to our being able to identify much more efficient targets than would have been possible using traditional metrics like cost per point or cost per adult viewer.
Even greater precision was available through addressable television. We generated lists of individuals who were scored as highly persuadable for persuasion ads, and likely supporters who might not vote for turnout ads. These were also segmented by demographics and by congressional district so that we could maximize the ad spend in districts where we were the closest to the tipping point for winning additional delegates.
Results
While ultimately Sanders narrowly lost the nomination, the campaign dramatically outperformed expectations at its launch, engaged segments of voters previously ignored by the Democratic Party, and eventually garnered the support of 47% of Democrats. The campaign resulted in the elevation of Sanders’ stature within the party and an ongoing engagement for Haystaq with the campaign’s successor organization Our Revolution.