
Report on Racial Bloc Voting Analysis for the State of Montana
Prepared for:
The Montana Districting and Apportionment Commission
Download a PDF of this Report
May 6, 2022
Synopsis
Analysis of the State of Montana’s election results going back to 2014 shows evidence of racial bloc voting (RBV) in the five regions solicited by the Montana Districting and Apportionment Commission. This analysis used general and party primary elections for ten races going back to 2014. We show the results of Homogeneous Precinct Analysis, Bivariate Regression Analysis, and Ecological Inference Analysis to support these findings. All analyses were run using two definitions of American Indian, “American Indian Any” and “American Indian Alone”, using Citizen Voting Age Population (CVAP) data. In the following report, we will walk you through our findings.
Introduction
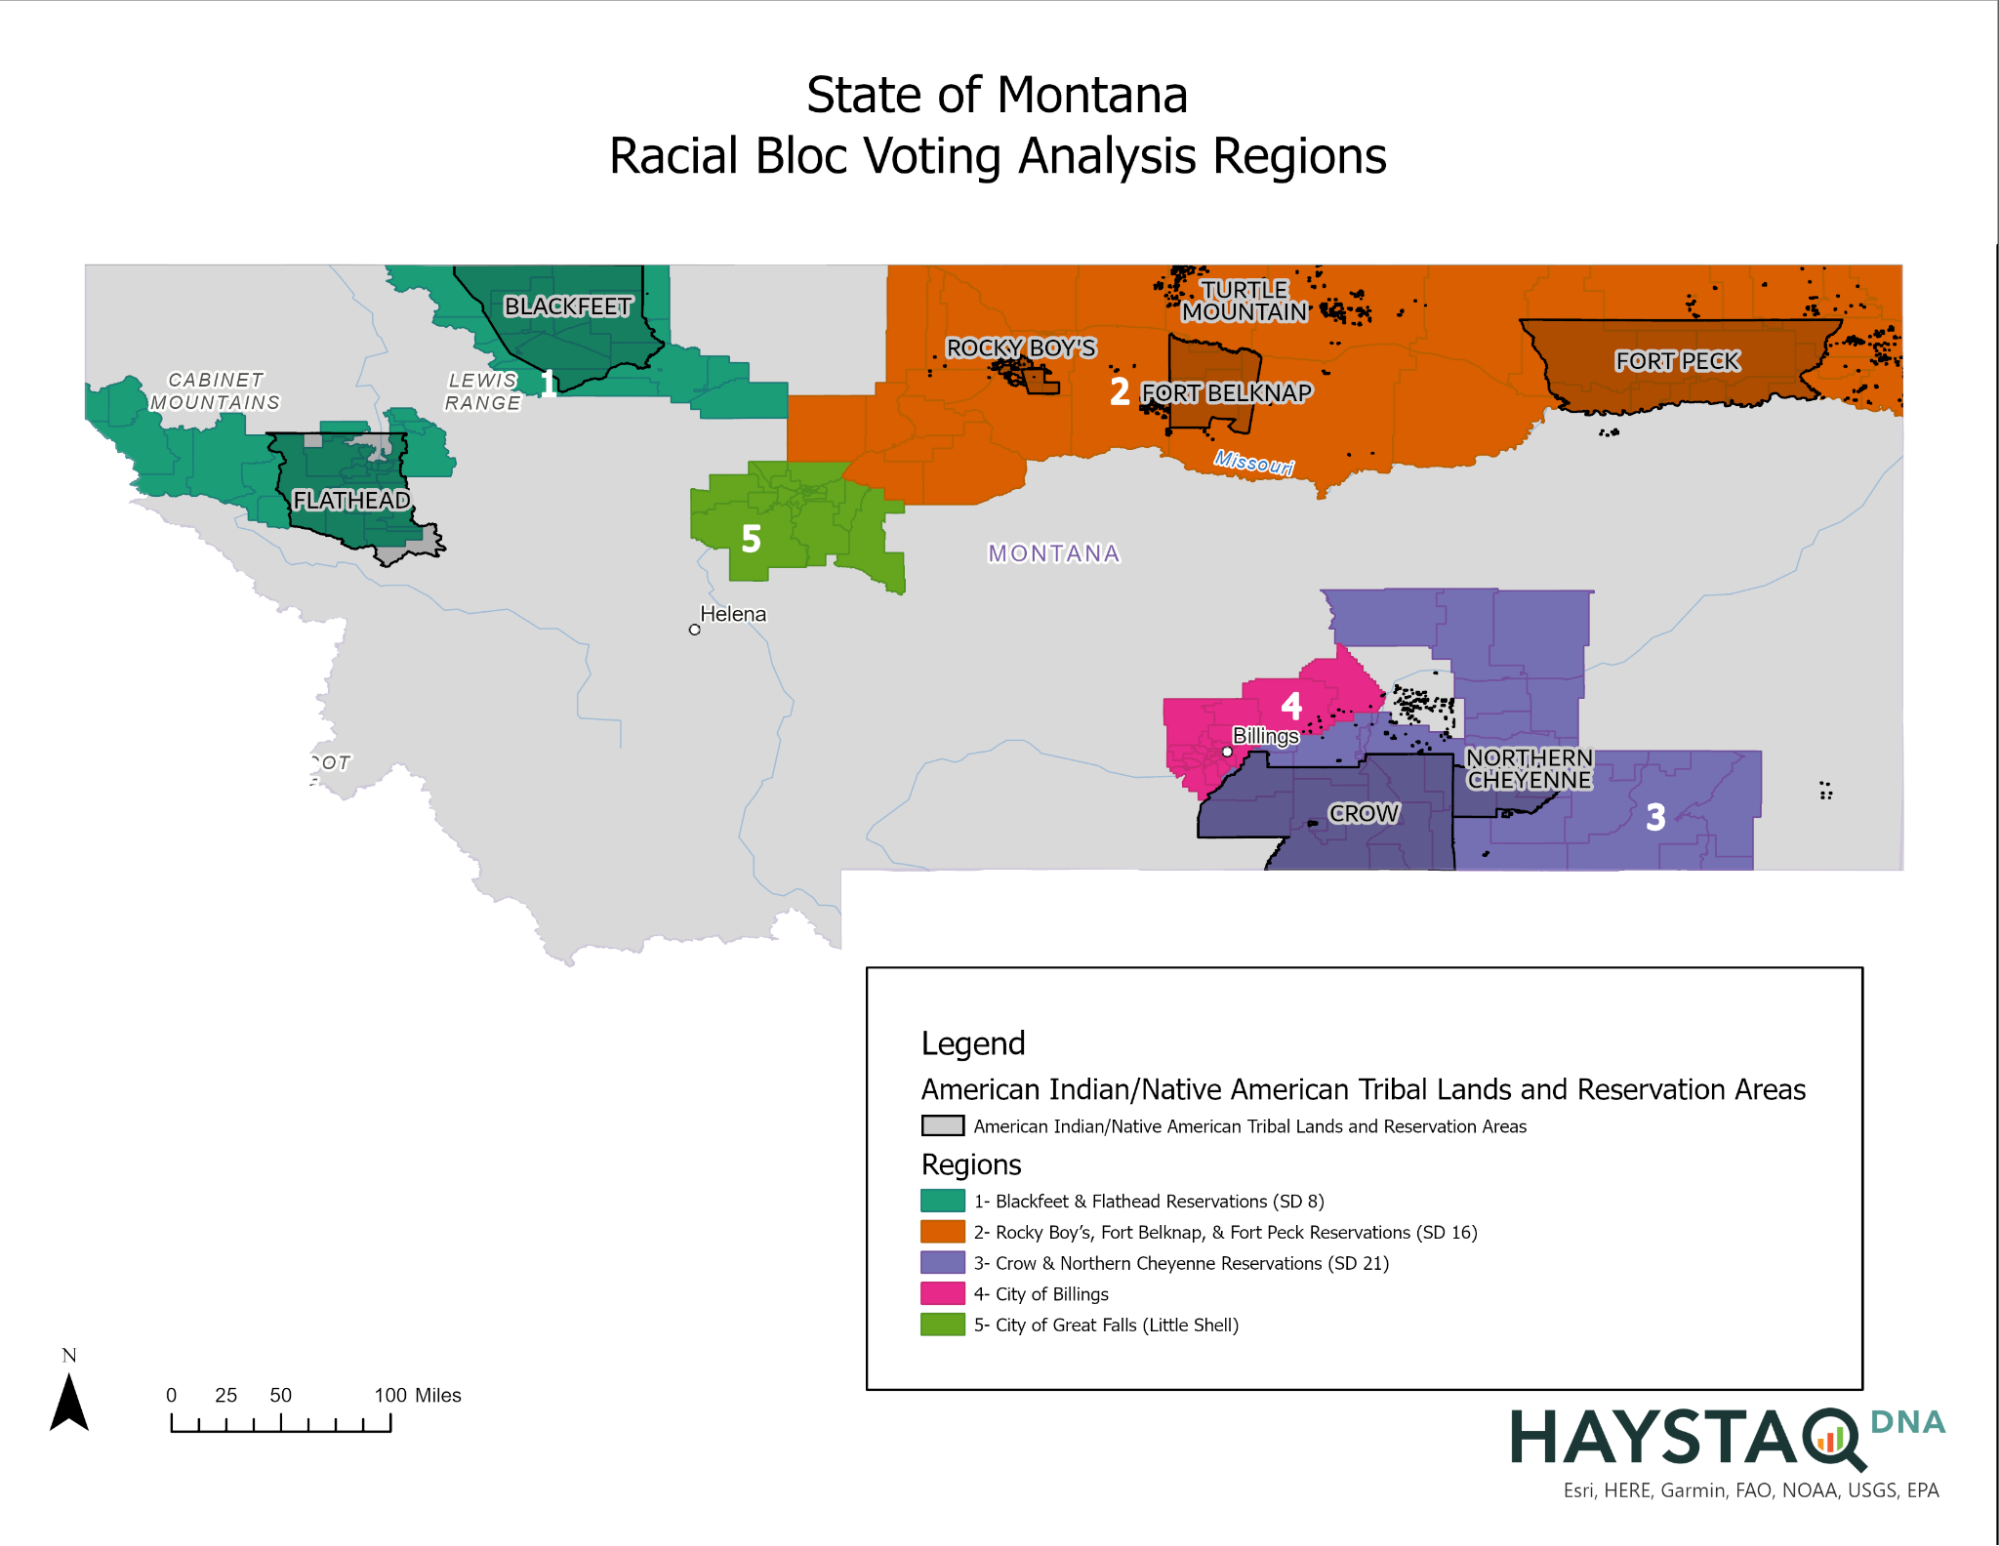
Figure 1: Map of the 5 regions for analysis defined by the MT Redistricting and Apportionment Commission
Since 2004, Montana’s legislative maps have included 6 majority-minority House Districts (out of 100 districts total) and 3 majority-minority Senate Districts (out of 50 districts total). These majority-minority House and Senate Districts cover all or part of 7 reservations in Montana, which guided our RBV analysis. In addition to the three regions spelled out below that surround current majority-minority legislative districts, the Montana Districting and Apportionment Commission has requested that Haystaq DNA analyze the two major cities with the highest American Indian populations, Great Falls and Billings.
As of the 2016-2020 American Community Survey 5-year Estimates released by the U.S. Census, Montana has a citizen voting age population statewide that is 6.53% “American Indian Alone” and 8.09% “Any Part American Indian.” For minority demographic groups, it was requested that HaystaqDNA look at citizen voting age populations for “Any Part American Indian,” as well as “American Indian Alone” to determine if racially polarized voting exists and to what extent amongst those two categories.
Regions
HaystaqDNA performed the analysis on five regions in the State of Montana to determine if there was RBV in past elections. Our analysis includes all precincts within 17 counties, broken down into the following five regions at the request of the Redistricting Commission. While regions 1 through 3 were selected because they encompass current majority-minority House and Senate Districts, it was proposed that our analysis include all precincts within the 17 counties listed below to ensure coverage of precincts both on and off reservation lands and both within and outside of current majority-minority legislative districts.
Region 1 – Blackfeet & Flathead Reservations (SD 8)
| Reservation | Senate District | House District | County |
| Blackfeet | SD 8 | HDs 15 & 16 | Glacier Co. Precincts |
| Blackfeet | SD 8 | HD 15 | Pondera Co. Precincts |
| Flathead | SD 8 | HD 15 | Lake Co. Precincts |
| Flathead | Sanders Co. Precincts |
Region 2 – Rocky Boy’s, Fort Belknap, & Fort Peck Reservations (SD 16)
| Reservation | Senate District | House District | County |
| Rocky Boy’s | SD 16 | HD 32 | Hill Co. Precincts |
| Rocky Boy’s | SD 16 | HD 32 | Chouteau Co. Precincts |
| Fort Belknap | SD 16 | HD 32 | Blaine Co. Precincts |
| Fort Belknap | SD 16 | HD 32 | Phillips Co. Precincts |
| Fort Peck | SD 16 | HD 31 | Roosevelt Co. Precincts |
| Fort Peck | SD 16 | HD 31 | Valley Co. Precincts |
| Fort Peck | Daniels Co. Precincts | ||
| Fort Peck | Sheridan Co. Precincts |
Region 3 – Crow & Northern Cheyenne Reservations (SD 21)
| Reservation | Senate District | House District | County |
| Crow | SD 21 | HDs 41 & 42 | Big Horn Co. Precincts |
| Crow | SD 21 | HD 42 | Yellowstone Co. Precincts 42.1 and
42.2 only (remaining Yellowstone Co. Precincts part of Billings Region) |
| Crow | SD 21 | HD 41 | Rosebud Co. Precincts |
| SD 21 | HD 41 | Powder River Co. Precincts |
Region 4 – City of Billings
| Reservation | Senate District | House District | County |
| Yellowstone County Precincts (excluding Precincts 42.1 and 42.2 which are included in a majority-minority House and Senate District and part of Region 3) |
Region 5 – City of Great Falls (Little Shell)
| Reservation | Senate District | House District | County |
| Cascade County Precincts |
Elections
The following elections were analyzed using Ecological Inference, Homogeneous Precinct Analysis and Bivariate Regression Analysis in each of the 5 regions. There were 10 races for analysis total, with 4 from each presidential election cycle and 1 from each midterm between 2014 and 2020. For each of the races listed below, we analyzed the election results from the General, Democratic Primary, and Republican Primary elections where applicable.
- 2014 U.S. Senate
- 2016 President
- 2016 Congressional
- 2016 Governor
- 2016 Attorney General
- 2018 U.S. Senate
- 2020 President
- 2020 U.S. Senate
- 2020 Attorney General
- 2020 Auditor
Data
Election Results & Precinct Shapefiles
Our process began with creating precinct shapefiles joined to election results for each year of elections, to reflect precinct geographies in place at the time of the election. We obtained the shapefile of Montana Voting Precincts from the Montana State Library Services repository. A shapefile is a geospatial vector data format for geographic information system (GIS) software. We use these shapefiles to spatially analyze the election results in comparison with population data. We obtained historical election results at the precinct level from the Montana Secretary of State website. Using the information below, we manually consolidated election results or precinct geographies.
Four of the 17 counties included in the region of study have had a precinct change between 2014 and 2020. The following is a list of the Precinct Changes between 2014 and 2020 which were made manually on the 2020 precinct shapefile before running the rest of the analysis.
Precinct changes between 2014 and 2016
- Yellowstone County (Region 4 – City of Billings)
o Consolidation: Precincts 40.2 and 45.1 consolidated into Precinct 40-45
Precinct Changes between 2016 and 2018
- Lake County (Region 1 – Flathead Reservation)
o Split: Precinct Pab 1 split from Ron 1
o Split: Precinct Pab 2 split from Ron 2
*The precinct geography for Ron 1 in 2014 and 2016 was equivalent to the current Pab 1 and Ron 1 combined on the Census Bureau’s 2020 Lake County VTDs. The precinct geography for Ron 2 in 2014 and 2016 was equivalent to the current Pab 2 and Ron 2 combined on the Census Bureau’s 2020 Lake County VTDs.
- Phillips County (Region 2 – Fort Belknap Reservation)
o Consolidation: Precincts 2s, 5, 6, 8s, 11 and 12s consolidated into 11S
o Consolidation: Precincts 2n, 7, 8n, 9-1, 9-2, 12n and 16 consolidated into 11N
- Valley County (Region 2 – Fort Peck Reservation)
o Consolidation: Precincts 1 and 2 consolidated into 31
o Consolidation: Precincts 2 and 4 consolidated int 33
o Consolidation: Precincts 5, 6, 7 and 8 consolidated into 34
Population Data
For the demographic population data, we used Citizen Voting Age Population (CVAP) from the American Community Survey 5-year Estimates released by the U.S. Census. These data are available at the Block Group level. We disaggregated the data from the Block Group level to the Block level, and then aggregated the data to precincts. This same process was followed for every election year, following the manual modifications made to the precinct shapefile reflecting the consolidations and changes made to precinct geography outlined above, to join CVAP from the year of the election to election results.
We performed the analysis using the “American Indian Alone” category, and also on an “Any Part American Indian” category that we created by combining “American Indian Alone”, “American Indian or White” and “American Indian and Black or African American.” We compared these American Indian categories to “White Alone” and “Other”, which is the combination of all remaining variables.
Methodologies
Homogeneous Precinct Analysis
Homogeneous precinct analysis is a method for estimating voting behavior by race or ethnicity by comparing voting patterns in “homogeneous precincts,” i.e. precincts that are composed of a single racial or ethnic group.
For example, if there is a precinct composed entirely of American Indian voters, and the voters within that precinct give 90% of their votes to Candidate X, then we know that 90% of the American Indian voters supported Candidate X. Since precincts are usually not exclusively one race or ethnicity, precincts that are 90% or more of a single race or ethnicity are usually considered homogeneous for the purposes of this analysis.
A drawback of homogeneous precinct analysis is that we are only able to perform it in a given region that has homogeneous precincts. For example, if a region does not have any precincts that are over 90% CVAP for the race or ethnicity of interest, we are unable to perform homogeneous precinct analysis.
For the purposes of our analysis, we define a homogeneous American Indian precinct to be any precinct that is 90% or more American Indian Alone or American Indian Any.
In Figure 2, we have an example of homogeneous precinct analysis from the 2016 General Election for Attorney General in Region 1.
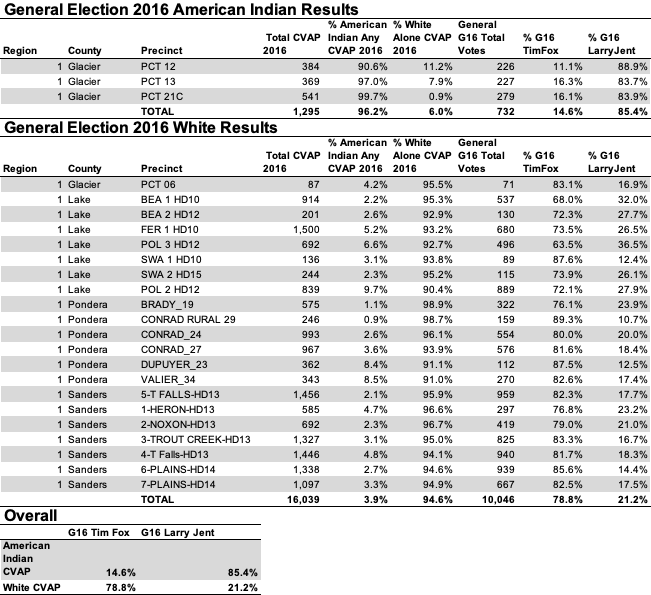
Figure 2: Bivariate regression plot: Attorney General, 2016 General Election, Region 1.
In Figure 2, we see in the first table that in all of Region 1, there are 3 homogeneous American Indian precincts, all in Glacier county. We see in the Total row that these precincts are overall 96.2% American Indian Any, and the vast majority of voters, 85.4%, voted for Larry Jent. In the second table, we can see that there are many more homogeneous white precincts in Region 1, and overall they are 94.6% white. The majority of voters in these precincts, 78.8%, voted for Tim Fox. These results show evidence of racial bloc voting in this election and region.
In the results section, we consider evidence of RBV to be present when we see greater than a 50% preference for the American Indian and White candidate of choice, and when those candidates differ.
Bivariate Regression Analysis
Bivariate regression analysis provides estimates of voting patterns by race or ethnicity across precincts, regardless of the existence of homogeneous precincts. The analysis shows the relationship between each candidate’s precinct-level vote share and the precinct-level CVAP for each race or ethnicity.
For example, in Figure 3, we can see the plot of % American Indian Alone, White Alone, and Other CVAP in comparison with the % of Votes for Tim Fox and Larry Jent in the 2016 General Election for Attorney General in Region 1.
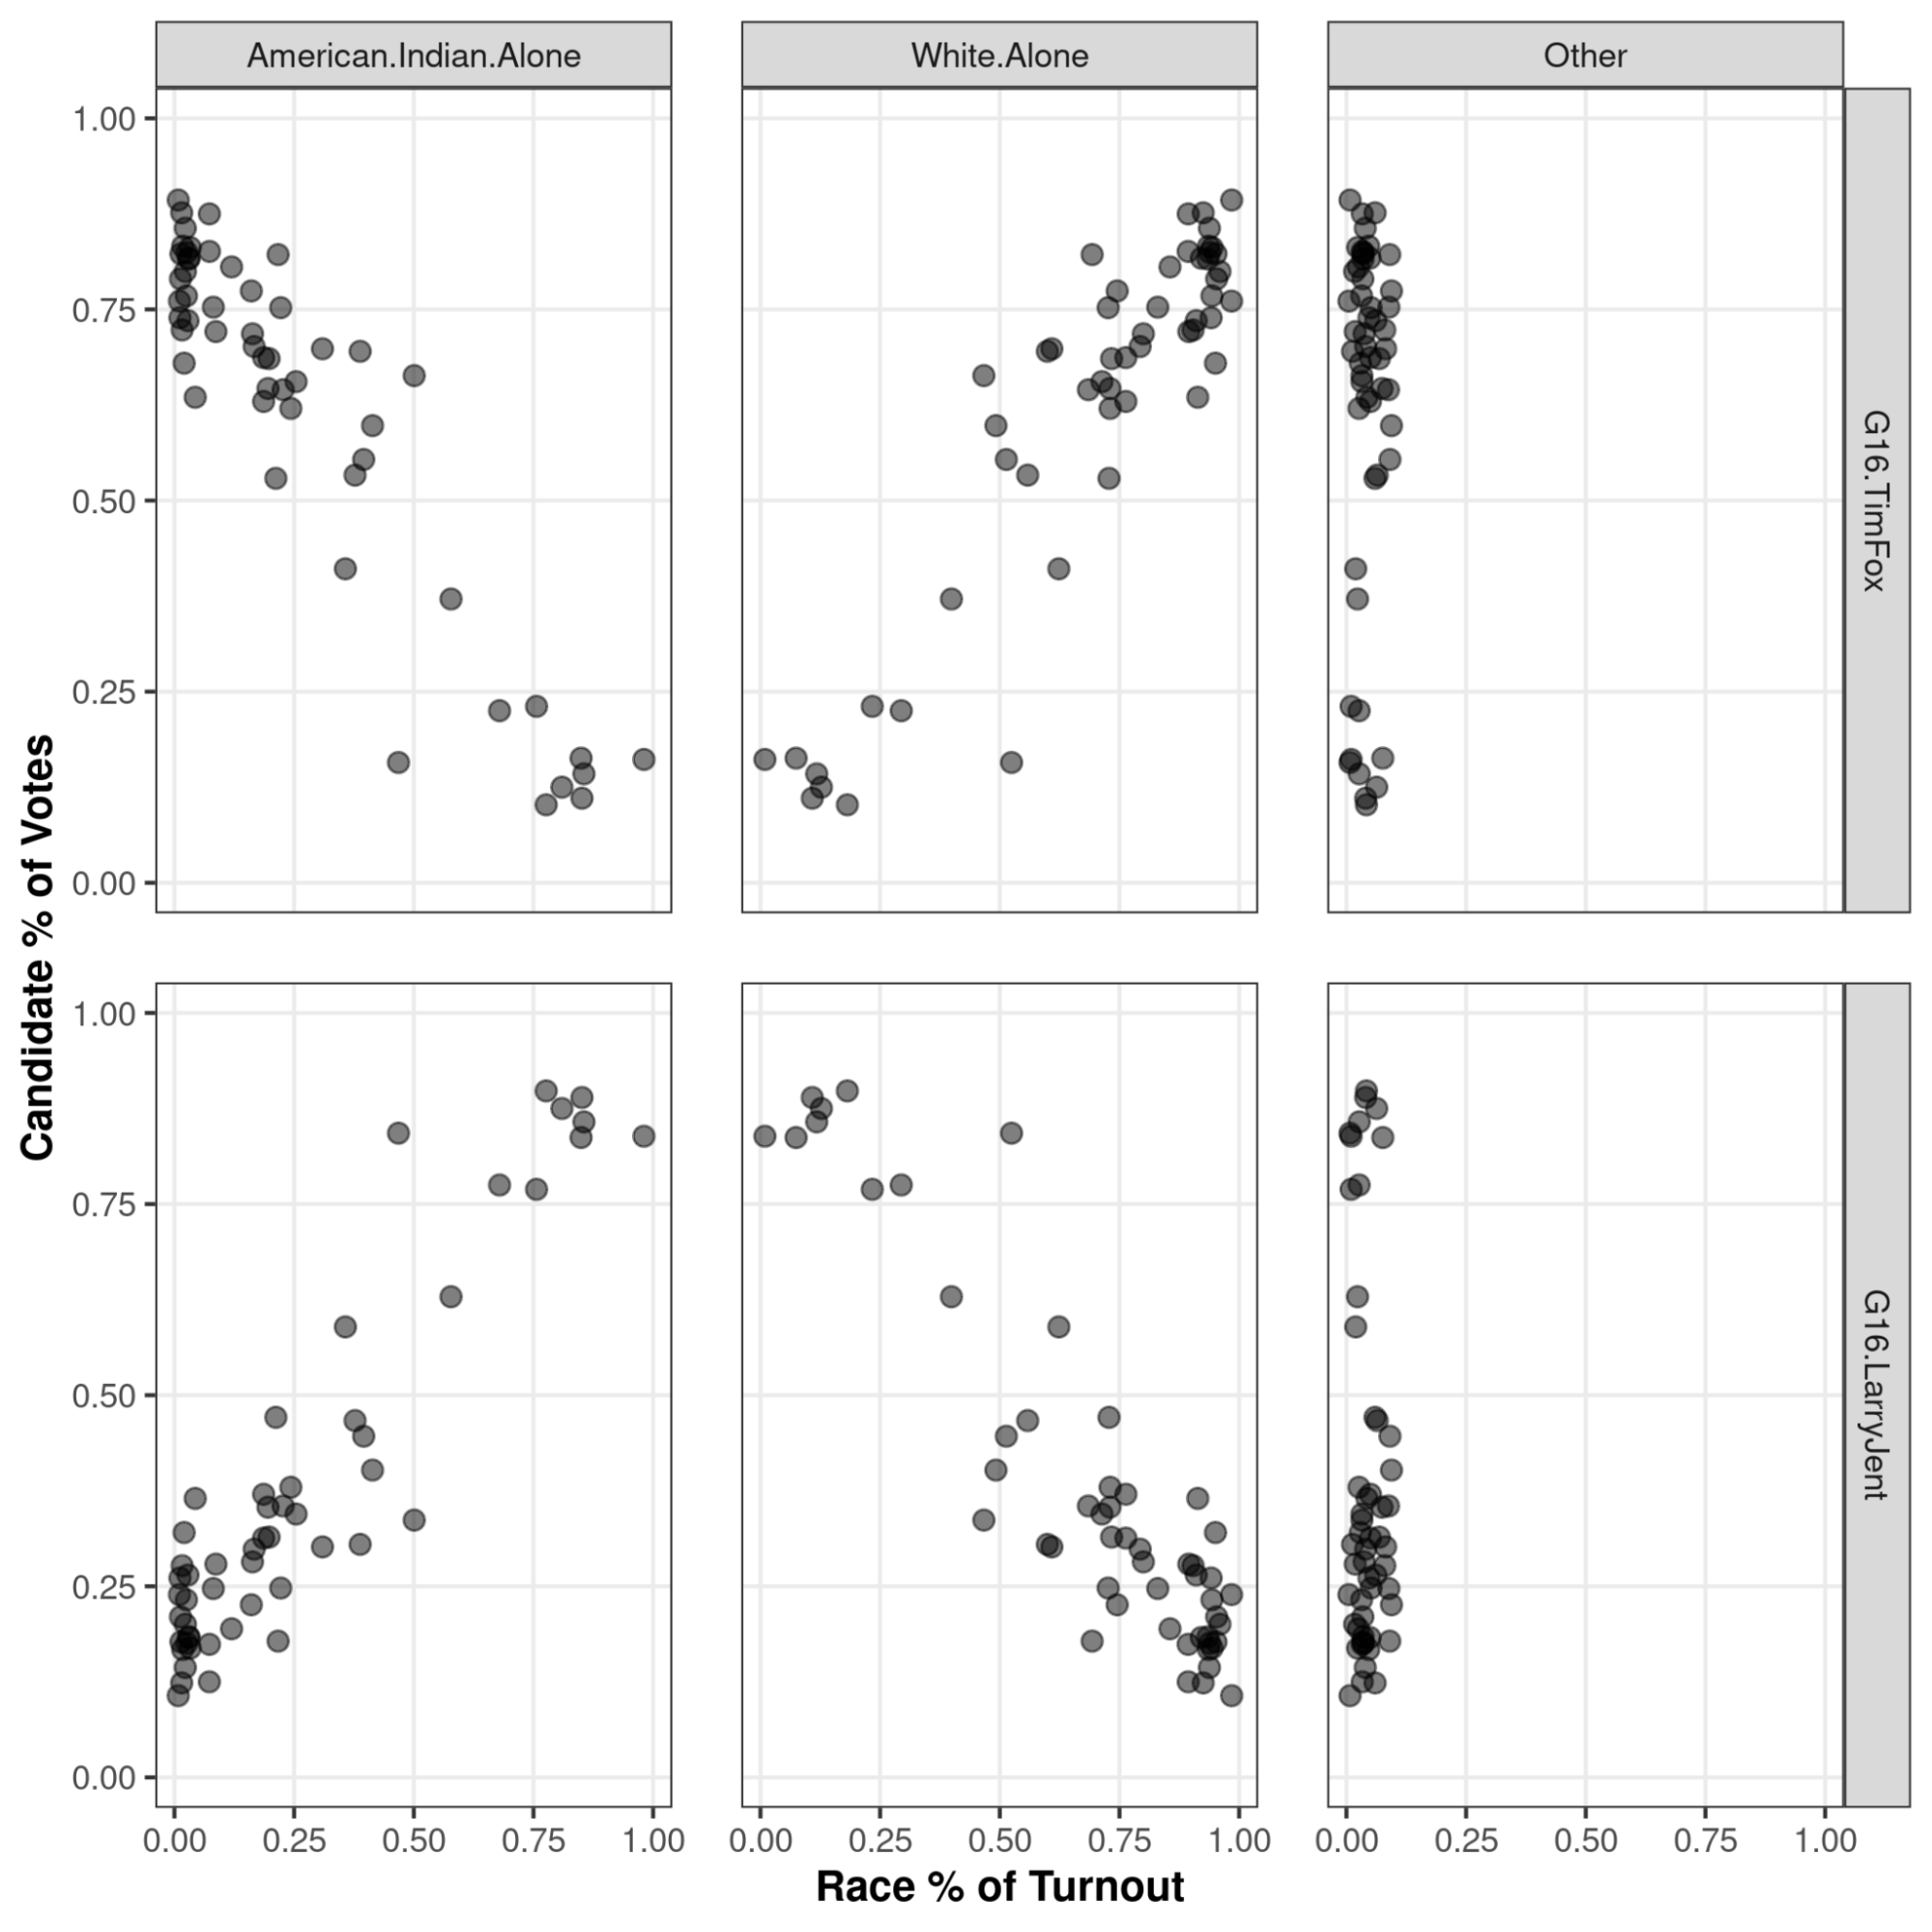
Figure 3: Bivariate regression plot: Attorney General, 2016 General Election, Region 1.
In Figure 3, each point represents a precinct and its share of CVAP on the x-axis vs the candidate votes in that precinct on the y-axis. In the top left, we can see as the proportion of American Indian Alone CVAP % increases, the share of votes for Tim Fox decreases. In the bottom right, we can see that as the proportion of American Indian Alone CVAP increases, the share of votes for Larry Jent increases. The inverse is true for the Whie Alone category. For the Other category, the % CVAP is so small that we cannot draw any conclusions.
In Figure 4, we can see the correlation coefficients for each bivariate relationship shown in Figure 3.

Figure 4: Bivariate regression correlation coefficients: Attorney General, 2016 General Election, Region 1.
For each plot, a correlation coefficient can be between -1 to 1, where -1 is a perfect negative correlation and 1 is a perfect positive correlation, or slope of the graph if we were to draw a line of best fit on each plot in Figure 3. Here, in Region 1, we see a strong positive correlation between American Indian Alone CVAP and votes for Larry Jent, with a coefficient of 0.9265. We also see a strong positive correlation between White Alone CVAP and votes for Tim Fox in the 2016 Attorney General’s race. These results show evidence of racial bloc voting in this election in Region 1.
In the results section, we consider evidence of RBV to be present when we see a strong positive correlation of greater than 0.5 for the American Indian and White candidate of choice, and when those candidates differ.
Ecological Inference Analysis
Ecological Inference (EI) is the process of drawing conclusions about individual-level behavior from aggregate-level data. The process involves using aggregate (historically called “ecological”) data to draw conclusions about individual-level behavior when no individual-level data are available. The fundamental difficulty with such inferences is that many different possible relationships at the individual level can generate the same observation at the aggregate level. For example, there are a very large number of ways in which electoral support for a political candidate can break down among individual voters and still produce the same aggregate level of support. In the absence of individual-level measurement (for example in the form of surveys), such information needs to be inferred.
EI analysis builds on ecological regression analysis by incorporating method of bounds and maximum likelihood estimation statistical techniques. For our analysis, we use the eiCompare package in R, which builds on Gary King’s ei package in R.
Figure 5 provides an example of EI analysis for the same election as the previous examples, the 2016 Attorney General election in Region 1.
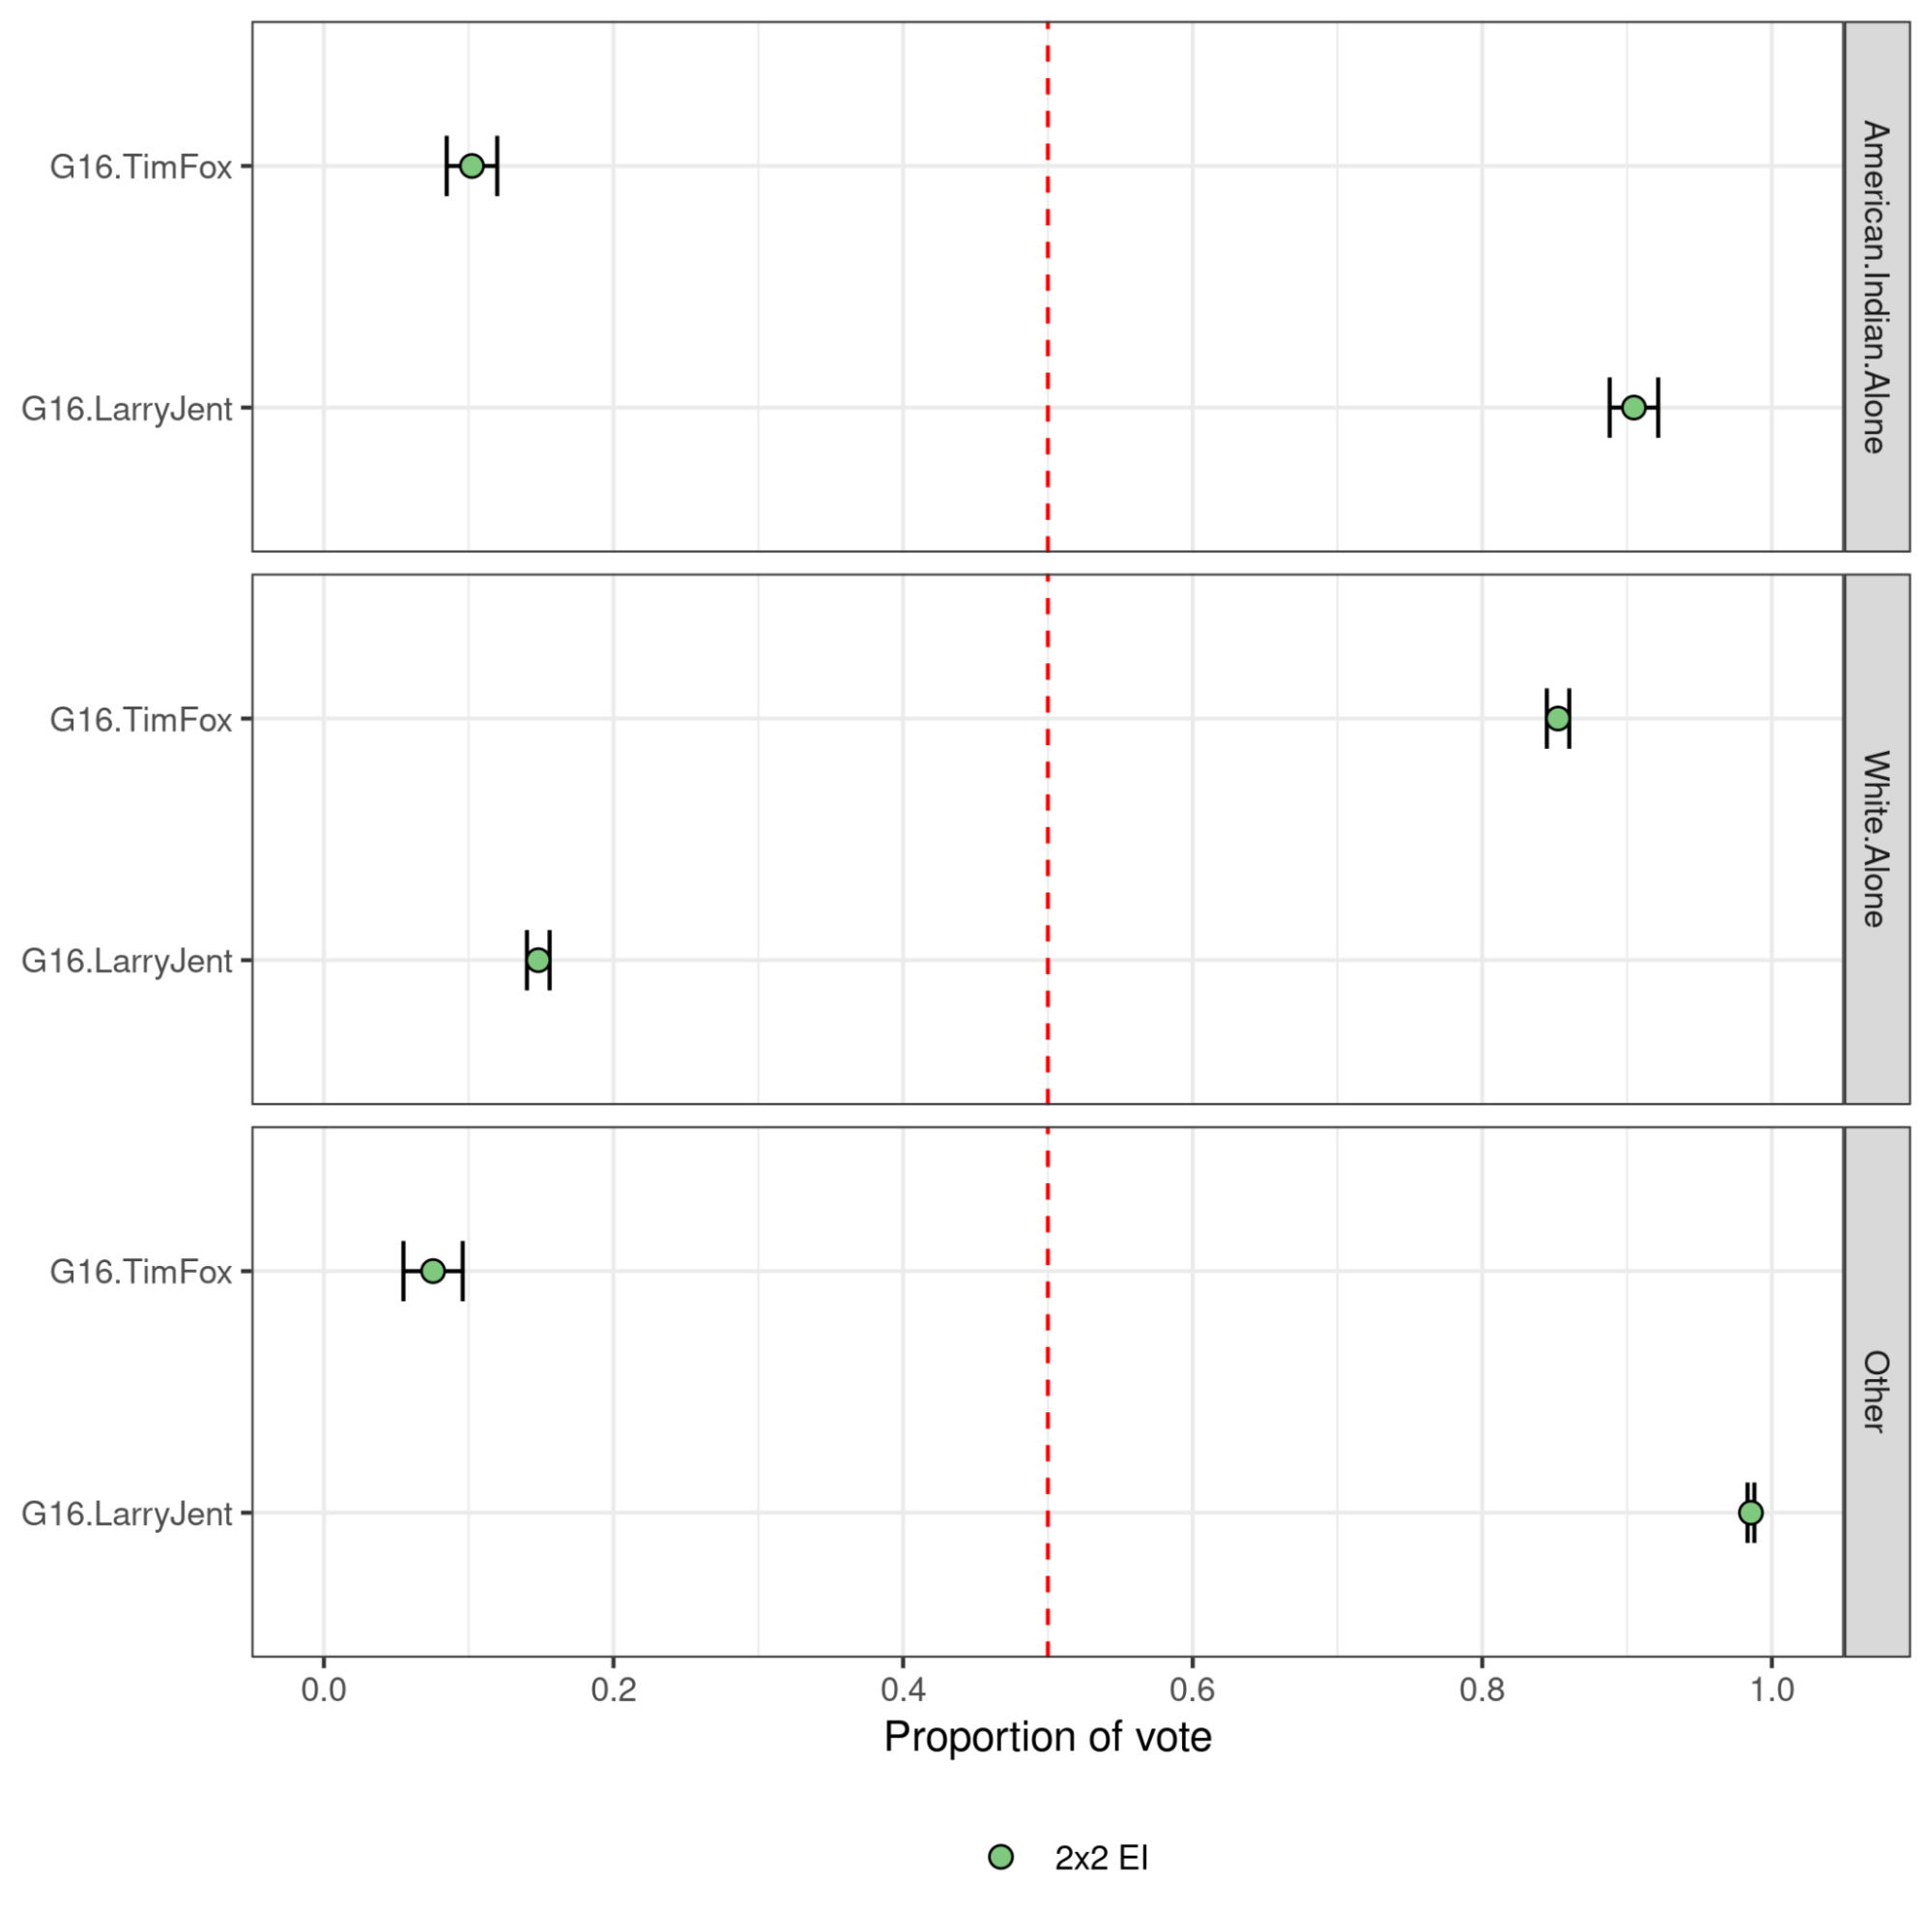
Figure 5: Ecological Inference Plot: Attorney General, 2016 General Election, Region 1.
In Figure 5, we see the estimates of the EI analysis. The green dots represent the EI estimate, and the lines on either side of the dots represent the confidence interval of the statistical estimate. When looking at the estimates for American Indian Alone in the top box, you can see that the estimate of votes is strongly for Larry Jent. For White CVAP, the preference is for Tim Fox.
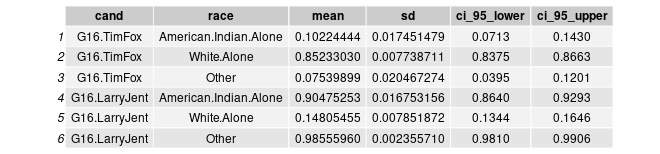
Figure 6: Ecological Inference Estimates: Attorney General, 2016 General Election, Region 1.
Figure 6 gives the precise estimates shown in the chart above. In the above example, the predicted support for Larry Jent among American Indian Alone CVAP was 90% and for White CVAP was 14.8%. The predicted support for Tim Fox among White CVAP was 85%. The confidence intervals (ci_95_lower and ci_95_upper) indicate that for this estimate, there is a 95% confidence that the true value of this statistically predicted support for Tim Fox among White CVAP is between 83.75% and 86.63%. These results show evidence of racial bloc voting in this election and region.
In the results section, we consider evidence of RBV to be present when we see a clear majority preference for both the American Indian and White candidate of choice and when those candidates differ.
Results
In looking at elections in Montana going back to 2014, we found evidence of racial bloc voting in each of the five regions we analyzed. That is, we found evidence that using either the “American Indian Alone” or the “American Indian Any” definition, American Indian voters vote cohesively in support of their candidate of choice, and that White voters often vote in a bloc for a different candidate of choice.
Across regions, we only saw a few instances where there was RBV for only one of “American Indian Alone” or “American Indian Any”, but not for both. Overall, the results were very similar between the two definitions of American Indian.
In the following sections, we provide summary level results of our findings for each Region that we analyzed. We are also providing a Supporting Appendix with the charts for each methodology and definition of American Indian where we found evidence of RBV.
Region 1 – Blackfeet & Flathead Reservations (SD 8)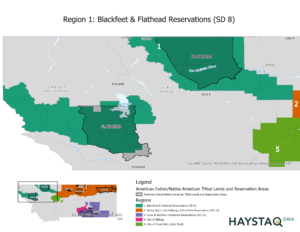

Figure 7: Region 1
Region 1 consists of all precincts in Glacier, Pondera, Lake, and Sanders counties. Region 1 has a total CVAP of approximately 47,434. The American Indian Alone CVAP is approximately 12,693, or 26.76%, and the American Indian Any CVAP is 14,021, or 29.57% of the total CVAP.
The examples provided in the methodology show evidence of racial bloc voting in the 2016 General Election for Attorney General.
In Region 1, the Homogeneous Precinct Analysis, Bivariate Regression Analysis, and Ecological Inference Analysis all showed evidence of RBV in the following elections, using both the American Indian Alone and American Indian Any definitions:
- 2014 U.S. Senate, General Election
- 2016 President, General Election
- 2016 Congressional, General Election
- 2016 Attorney General, General Election
- 2016 Governor, General Election
- 2018 U.S. Senate, General Election
- 2020 President, General Election
- 2020 U.S. Senate, General Election
- 2020 Attorney General, General Election
- 2020 Auditor, General Election
In addition, we found evidence of RBV with the following methods and elections:
- Homogeneous Precinct Analysis showed RBV in the 2016 Presidential Democratic Primary and the 2020 Attorney General Republican Primary.
- Bivariate Regression Analysis showed RBV in the 2014 US Senate Republican Primary and the 2016 Gubernatorial Republican Primary for both American Indian Alone and American Indian Any definitions.
Our analysis did not find evidence of RBV using Ecological Inference in any primary elections in Region 1.
Region 2 – Rocky Boy’s, Fort Belknap, & Fort Peck Reservations (SD 16)
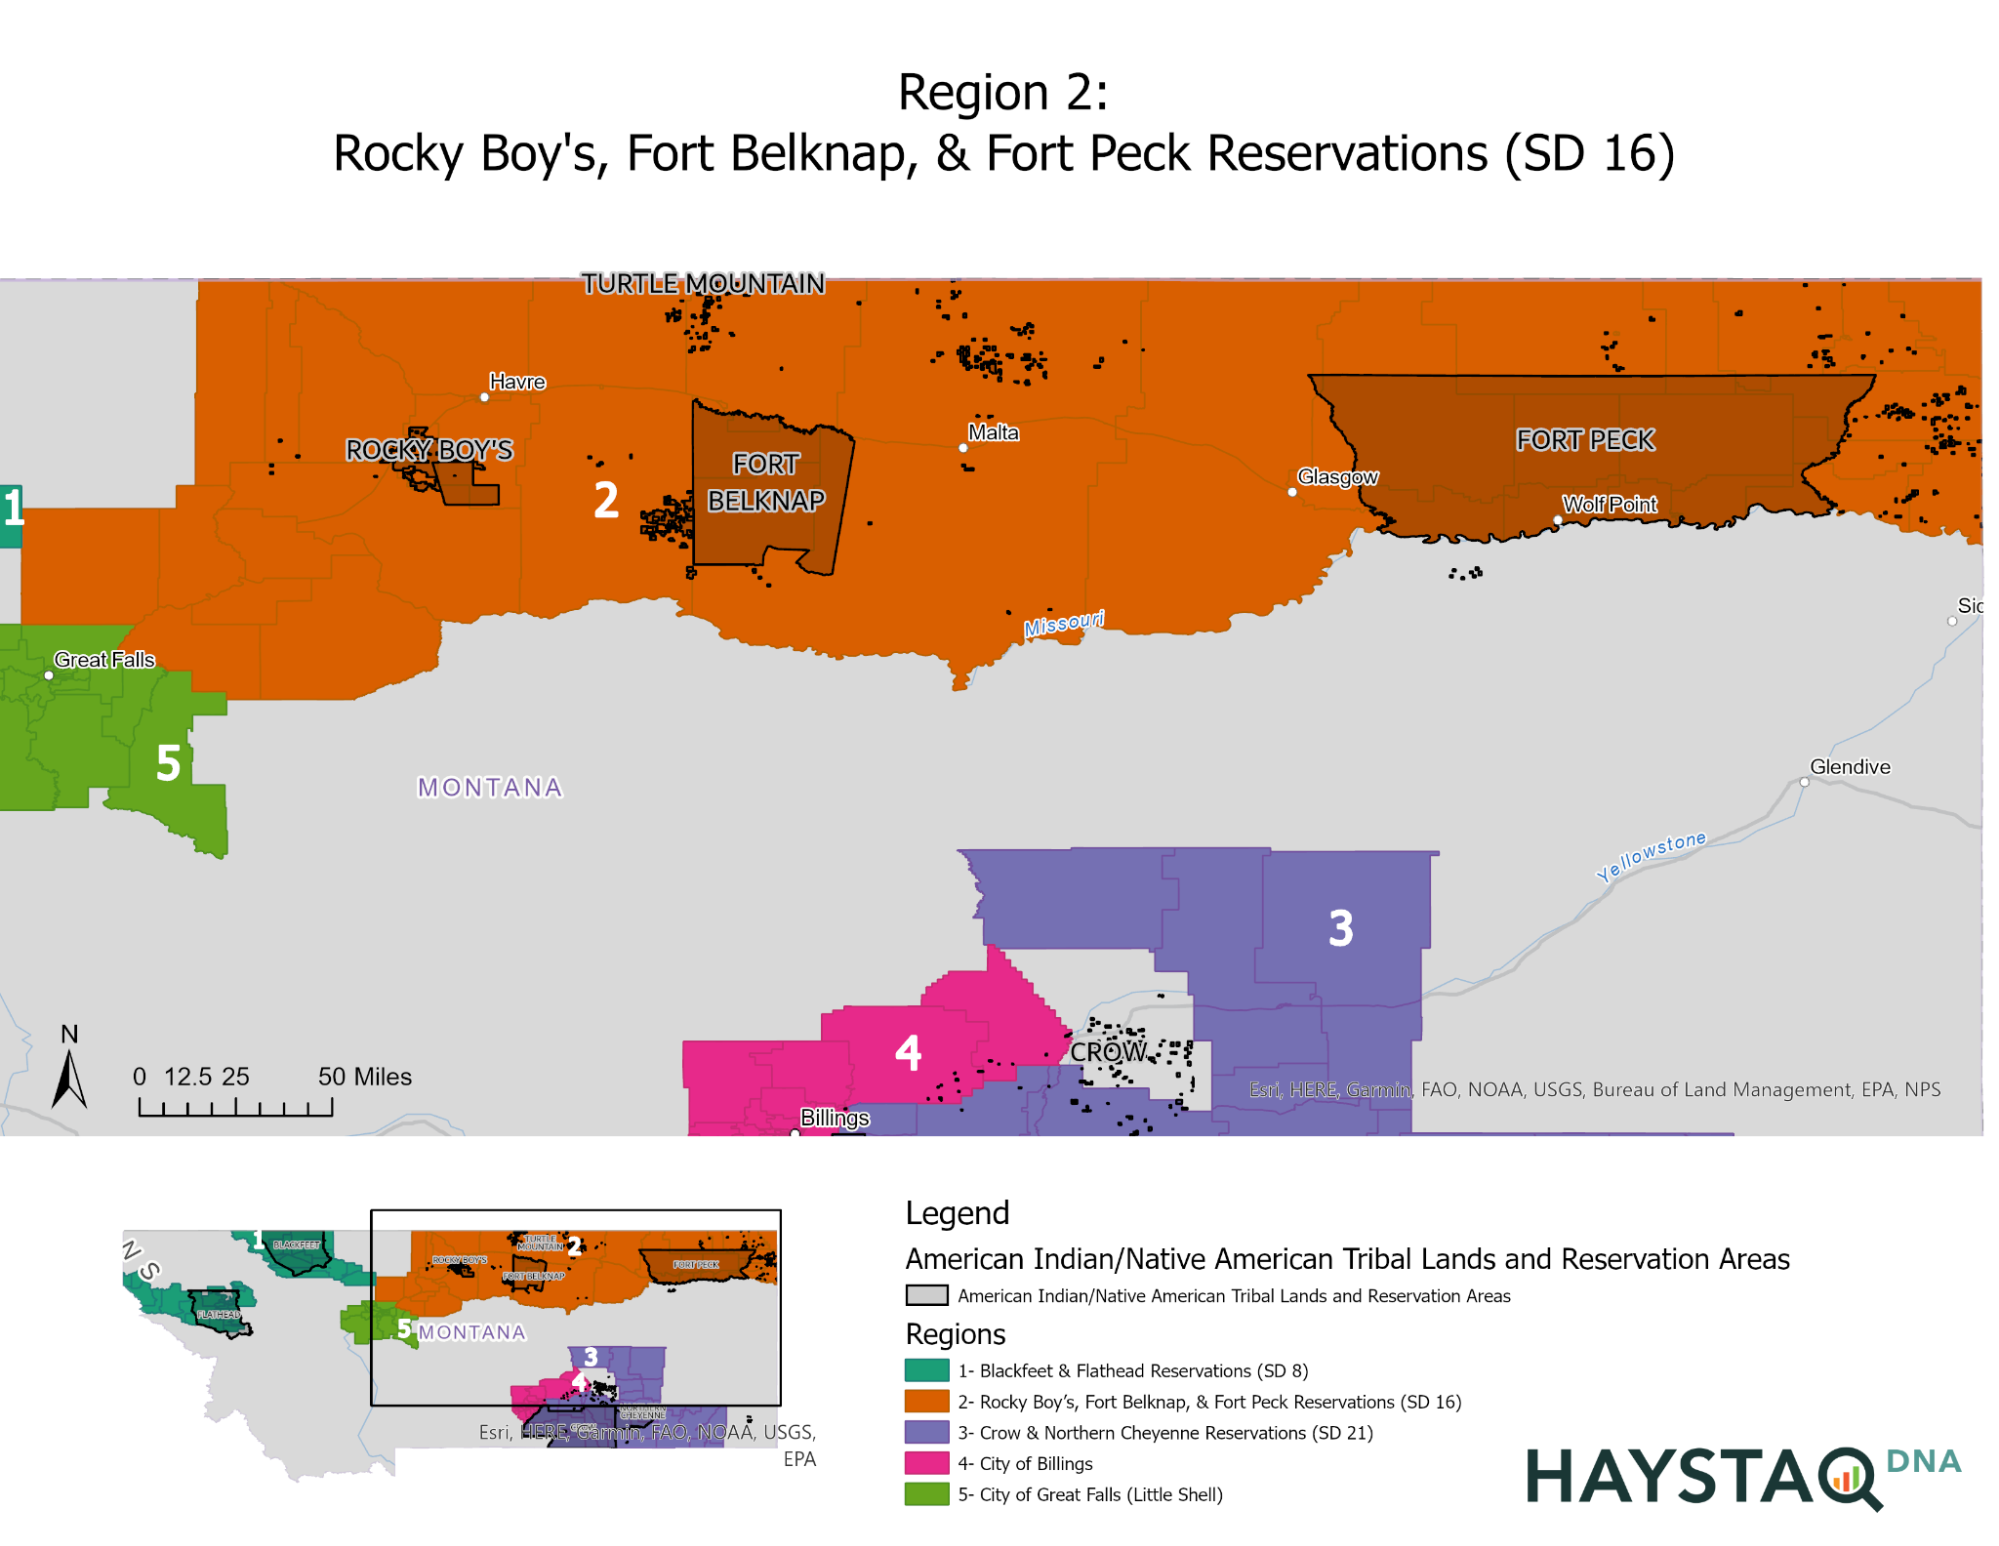
Figure 8: Region 2
Region 2 consists of all precincts in Hill, Chouteau, Blaine, Phillips, Roosevelt, Valley, Daniels, and Sheridan counties. Region 2 has a total CVAP of approximately 40,957. The American Indian Alone CVAP is approximately 10,590, or 25.9%, and the American Indian Any CVAP is 11,581, or 28.3% of the total CVAP.
In Region 2, the Homogeneous Precinct Analysis, Bivariate Regression Analysis, and Ecological Inference Analysis all showed evidence of RBV in the following elections, using both the American Indian Alone and American Indian Any definitions:
- 2014 U.S. Senate, General Election
- 2016 President, General Election
- 2016 Congressional, General Election
- 2016 Governor, General Election
- 2016 Attorney General, General Election
- 2018 U.S. Senate, General Election
- 2020 President, General Election
- 2020 U.S. Senate, General Election
- 2020 Attorney General, General Election
- 2020 Auditor, General Election
- 2020 Auditor, Democratic Primary
The 2016 Democratic Primary Election for President showed evidence of RBV using the Homogeneous Precinct Analysis and Ecological Inference Analysis, using both the American Indian Alone and American Indian Any definitions.
Region 3 – Crow & Northern Cheyenne Reservations (SD 21)
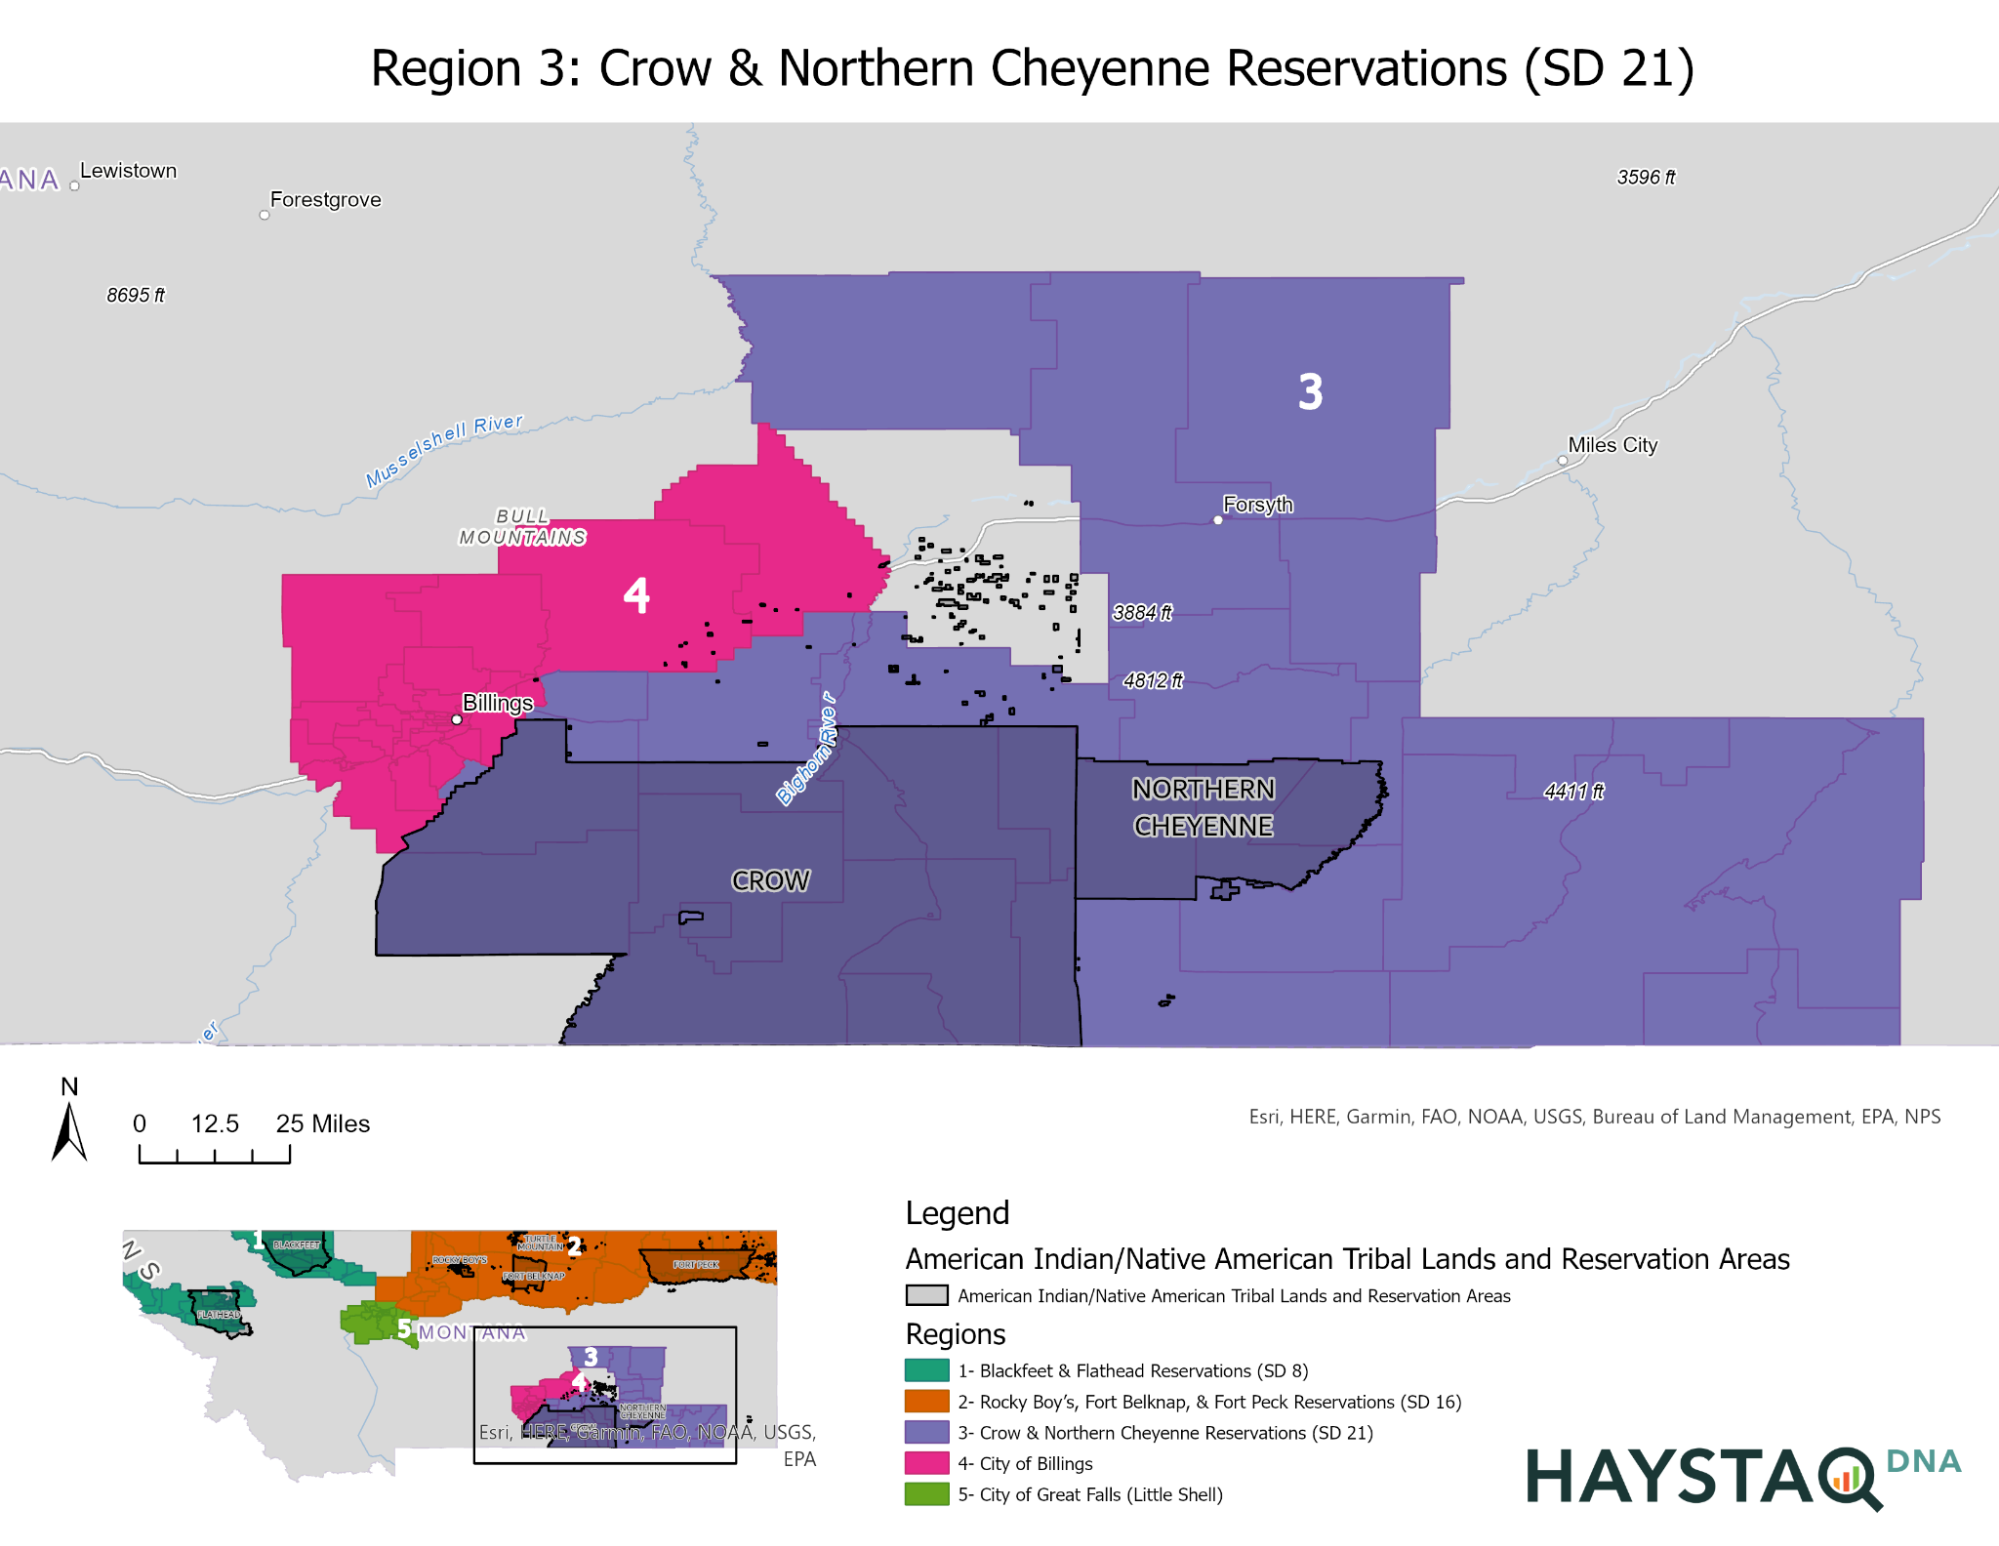
Figure 9: Region 3
Region 3 consists of all precincts in Big Horn, Rosebud, and Powder River Counties. Region 3 also includes Yellowstone County Precincts 42.1 and 42.2 (remaining Yellowstone County precincts not in the Billings region). Region 3 has a total CVAP of approximately 17,532. The American Indian Alone CVAP is approximately 7,615, or 43.4%, and the American Indian Any CVAP is 8,016, or 45.7% of the total CVAP.
In Region 3, the Homogeneous Precinct Analysis, Bivariate Regression Analysis, and Ecological Inference Analysis all showed evidence of RBV in the following elections, using both the American Indian Alone and American Indian Any definitions:
- 2014 U.S. Senate, General Election
- 2016 President, General Election
- 2016 Congressional, General Election
- 2016 Attorney General, General Election
- 2016 Governor, General Election
- 2018 U.S. Senate, General Election
- 2020 President, General Election
- 2020 U.S. Senate, General Election
- 2020 Attorney General, General Election
- 2020 Auditor, General Election
In addition, we found evidence of RBV with the following methods and elections:
- Ecological Inference showed evidence of RBV in the 2020 Attorney General Democratic Primary for both American Indian Alone and American Indian Any definitions.
- Bivariate Regression Analysis showed evidence of RBV in the 2016 Presidential Republican Primaries for both American Indian Alone and American Indian Any definitions.
- Homogeneous Precinct Analysis showed evidence of RBV in the 2016 Gubernatorial Republican Primary.
Region 4 – City of Billings
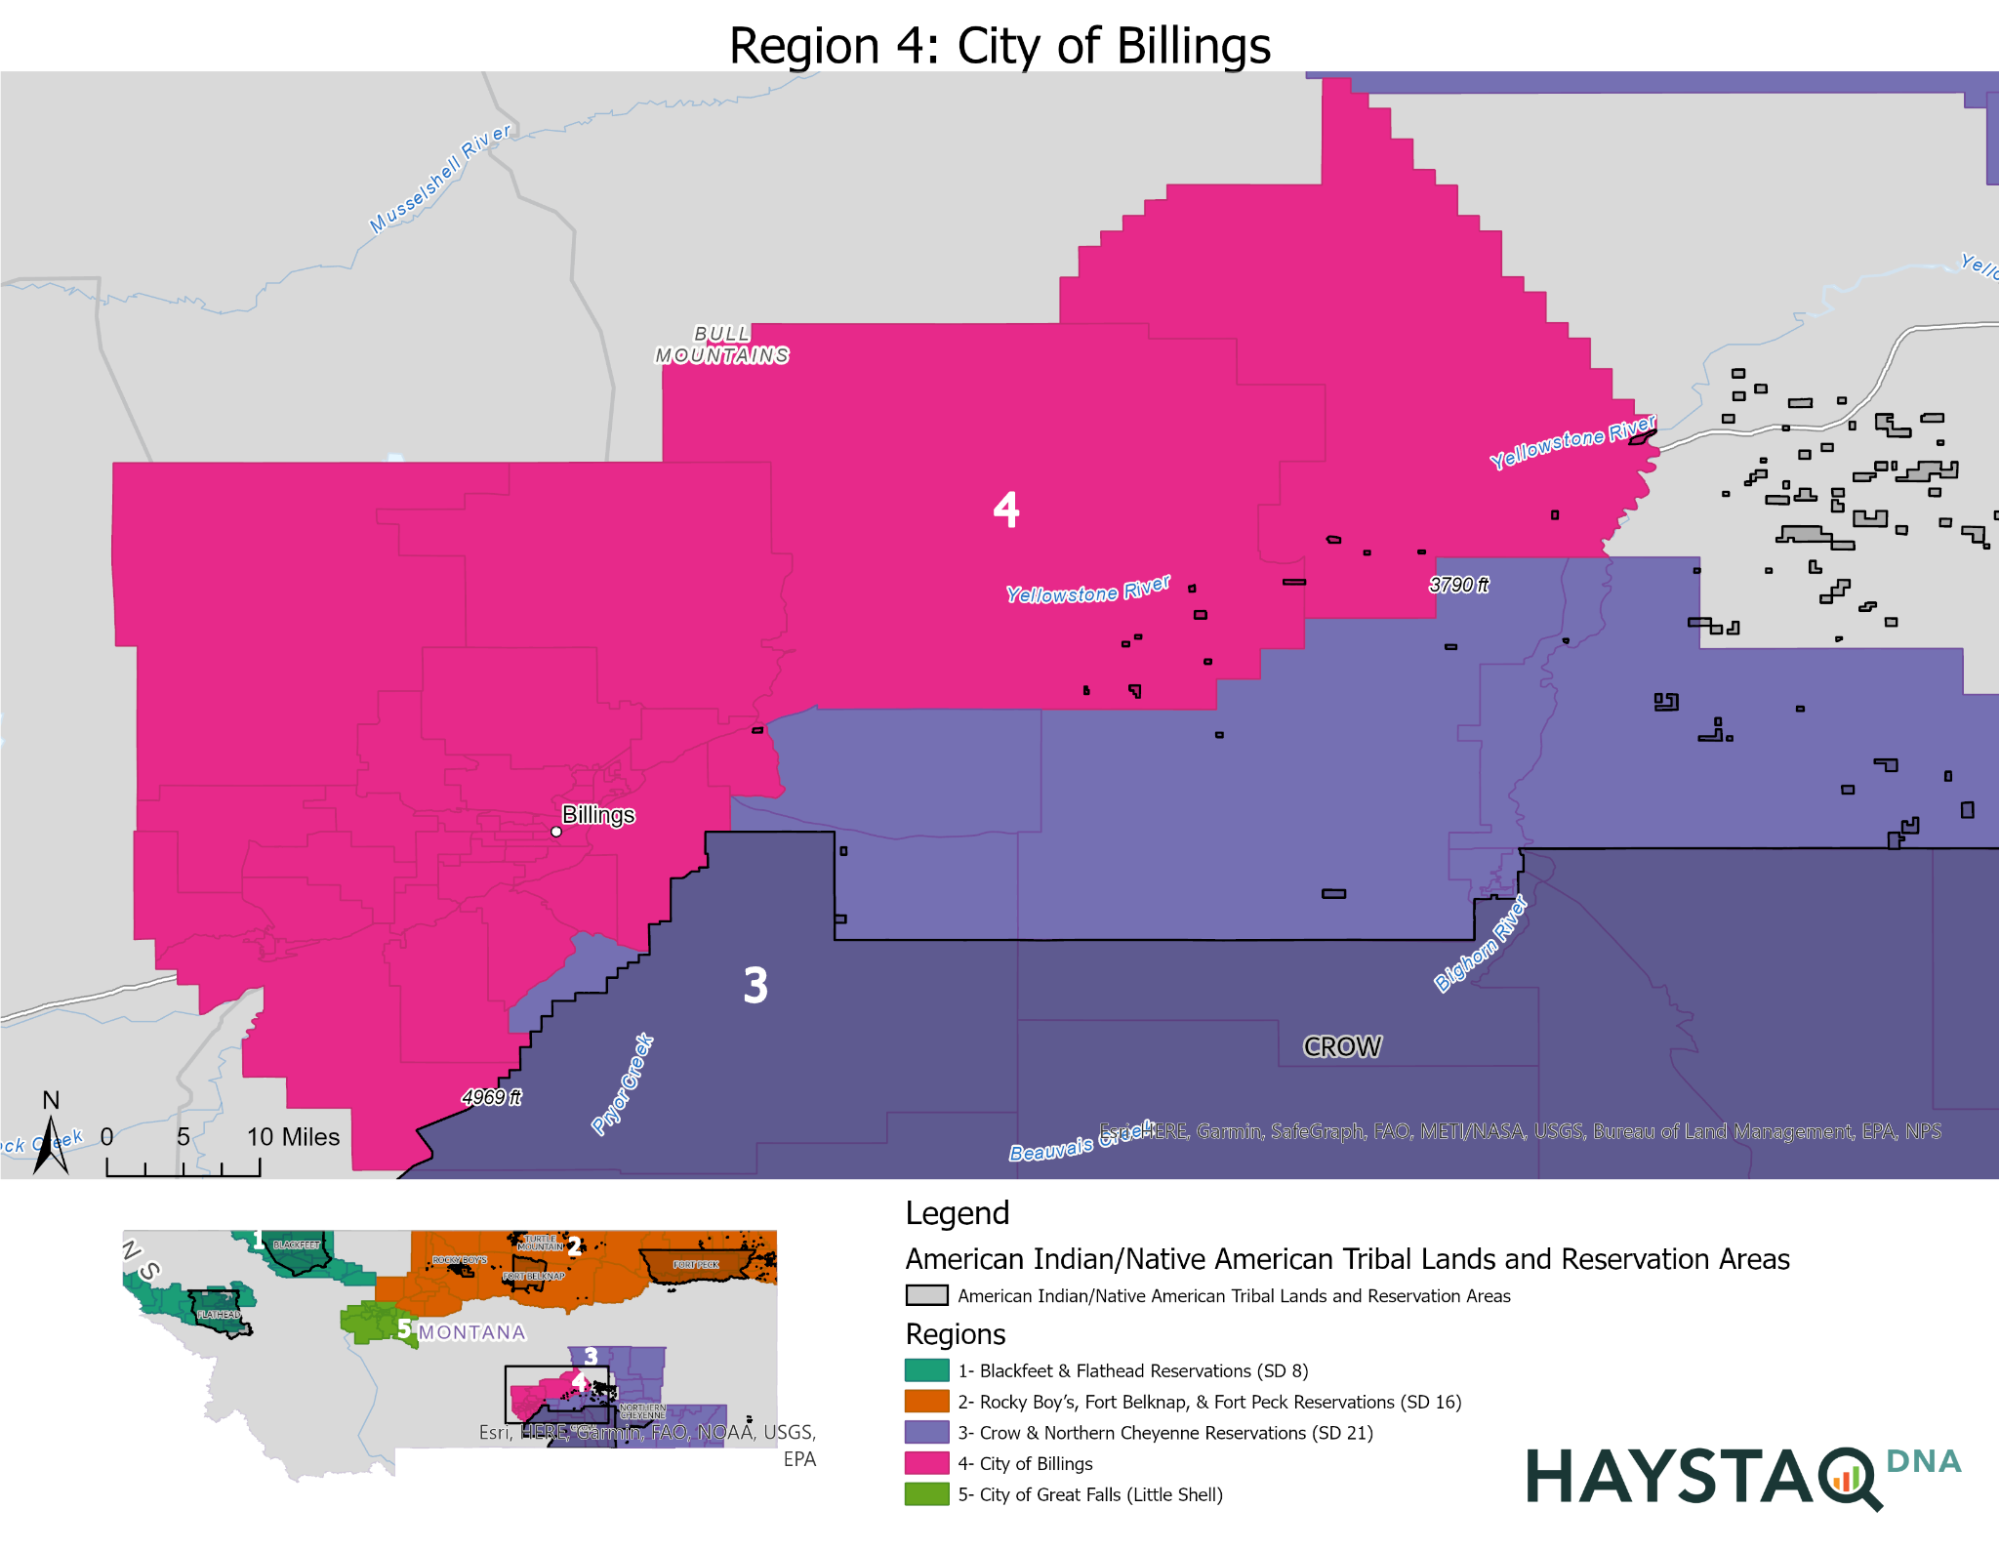
Figure 10: Region 4
Region 4 consists of all precincts in Yellowstone County, except for precincts 42.1 and 42.2 which are included in Region 3. Region 4 has a total CVAP of approximately 121,688. The American Indian Alone CVAP is approximately 5,484, or 4.5%, and the American Indian Any CVAP is 7,351, or 6% of the total CVAP.
In Region 4, we were not able to perform Homogeneous Precinct Analysis because there were no homogeneous American Indian Alone or American Indian Any precincts, where the American Indian CVAP was 90% or more of the total CVAP.
The Bivariate Regression Analysis and Ecological Inference Analysis showed evidence of RBV in the following elections, using both the American Indian Alone and American Indian Any definitions:
- 2014 U.S. Senate, General Election
- 2016 President, General Election
- 2016 Congressional, General Election
- 2016 Governor, General Election
- 2016 Attorney General, General Election
- 2018 U.S. Senate, General Election
- 2020 President, General Election
- 2020 U.S. Senate, General Election
- 2020 Attorney General, General Election
- 2020 Auditor, General Election
Additionally, the Ecological Inference alone showed evidence of RBV in the following elections, using both the American Indian Alone and American Indian Any definitions:
- 2014 U.S. Senate, Democratic Primary
- 2016 President, Democratic Primary
- 2016 Governor, Republican Primary
- 2018 U.S. Senate, Republican Primary
- 2020 President, Democratic Primary
- 2020 Attorney General, Democratic Primary
- 2020 Attorney General, Republican Primary
- 2020 Auditor, Democratic Primary
Using only the American Indian Alone definition, the Ecological Inference showed RBV in the following elections as well:
- 2014 U.S. Senate, Republican Primary
- 2020 Auditor, Republican Primary
Using only the American Indian Any definition, the Ecological Inference showed RBV in the following election as well:
- 2016 President, Republican Primary
The Bivariate Regression also shows RBV in the 2020 U.S. Senate Republican Primary for American Indian Alone and American Indian Any.
Region 5 – City of Great Falls (Little Shell)
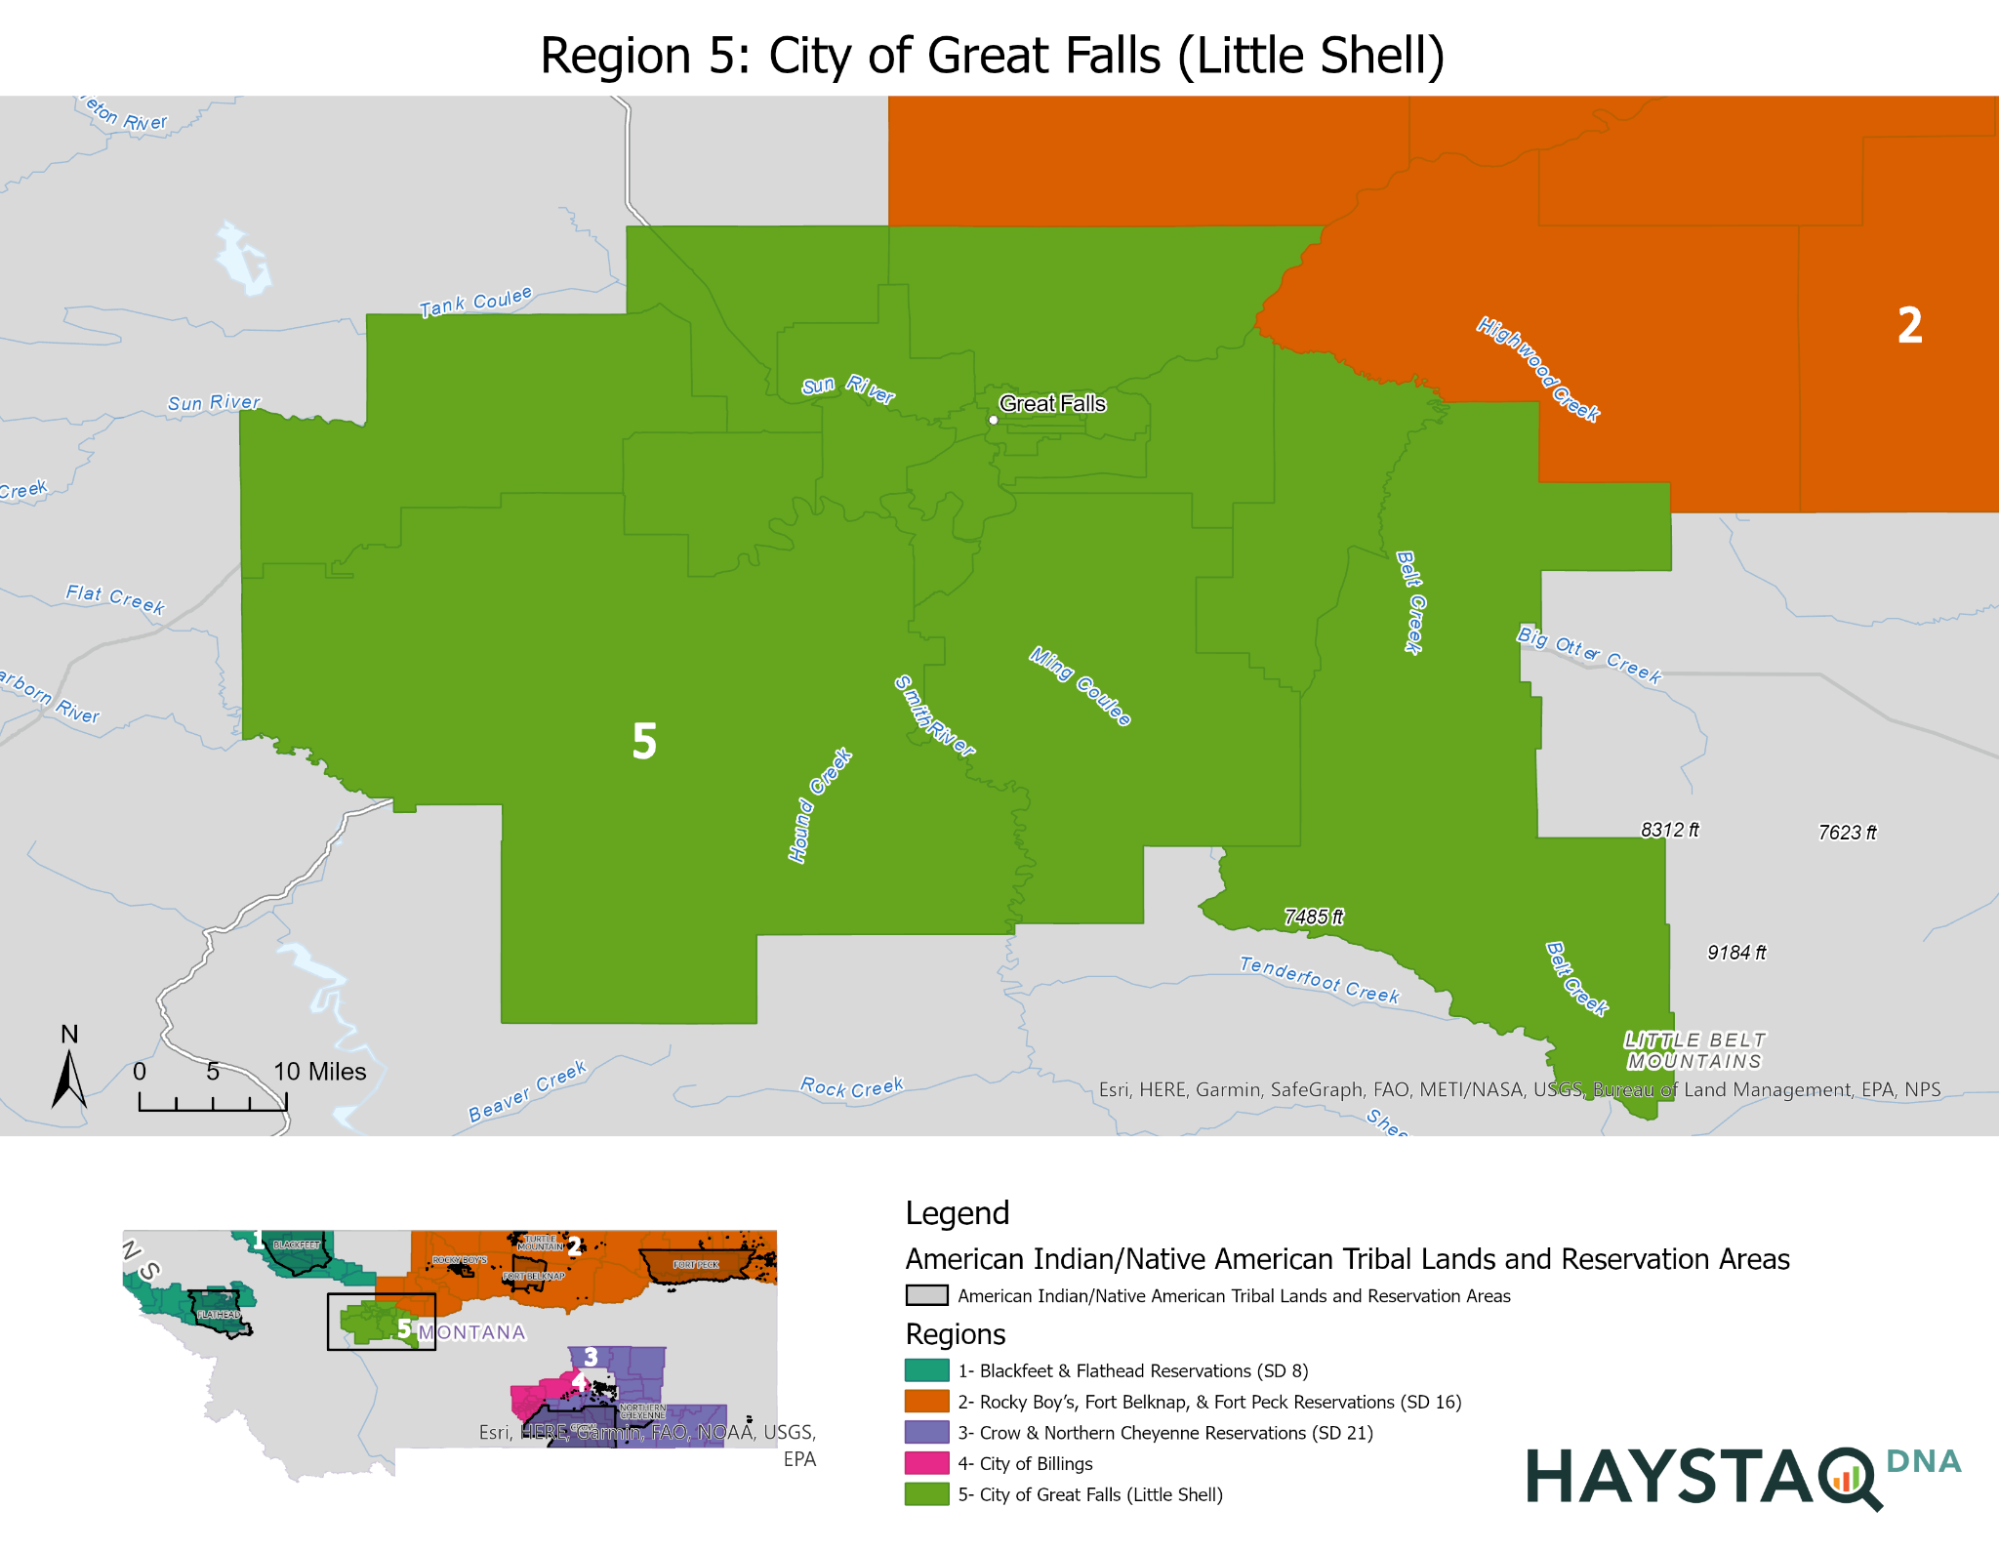
Figure 11: Region 5
Region 5 consists of all precincts in Cascade County. Region 5 has a total CVAP of approximately 63,032. The American Indian Alone CVAP is approximately 3,434, or 5.5%, and the American Indian Any CVAP is 4,697, or 7.5% of the total CVAP.
In Region 5, we were not able to perform Homogeneous Precinct Analysis because there were no homogeneous American Indian Alone or American Indian Any precincts, where the American Indian CVAP was 90% or more of the total CVAP.
The Ecological Inference Analysis showed evidence of RBV in the following elections, using both the American Indian Alone and American Indian Any definitions:
- 2014 U.S. Senate, General Election
- 2016 President, General Election
- 2016 Congressional, General Election
- 2016 Attorney General, General Election
- 2018 U.S. Senate, General Election
- 2020 President, General Election
- 2020 U.S. Senate, General Election
- 2020 Attorney General, General Election
- 2020 Attorney General, Democratic Primary
- 2020 Auditor, General Election
- 2020 Auditor, Democratic Primary
Additionally, the Ecological Inference showed evidence of RBV in the 2016 Presidential Democratic Primary using American Indian Alone only.
Supporting Appendices
Attached to this report is a folder of Supporting Appendices that has the following structure:
Supporting Appendices
Bivariate Regression and Ecological Inference Analysis – this folder contains all charts as shown in the methodology section for these analysis, where we found evidence of RBV. The charts are broken out by Region.
Region 1
Files ending in ‘Bivariate Plot’ and ‘Bivariate Coefficients’ show the results of the Bivariate Regression Analysis.
Files ending in ‘EI Plot’ and ‘EI Estimates’ show the results of the Ecological Inference Analysis.
G stands for General Election, DemP stands for Democratic Primary, RepP stands for Republican Primary in the file names.
AI stands for American Indian in the file names.
Region 2
Region 3
Region 4
Region 5
Homogeneous Precinct Analysis – this folder contains data files (in CSV format) of the results of the homogeneous precinct analysis for all regions that had precincts that were 90% or more American Indian Any/Alone or White.
G stands for General Election, DemP stands for Democratic Primary, RepP stands for Republican Primary in the file names.
AI stands for American Indian in the file names.
Leave a Reply