Download a PDF of the Case Study
Leading Microtargeting firm HaystaqDNA has developed an Automotive Microtargeting Engine that allows automotive OEMs and dealers to select conquest targets based on HaystaqDNA’s powerful predictive models. Compared to traditional list providers these models show up to 80% higher conversion rates on email and direct mail. When used with addressable TV, the HaystaqDNA models yield a 70% higher conversion rate. Marketers for automotive OEMs in the United States must not only sell more cars to existing customers, but also capture new customers from other brands in order to maintain and increase sales. The traditional method of ‘conquesting’ is to buy lists of target customers from generic consumer data vendors such as Experian or Axicom or from US Industry specific vendors such as Polk or AutoIntenders. Unfortunately for the OEM’s buying these lists, their competitors are often buying the exact same targets. These lists are based on basic demographics and targeted to a vehicle segment (example: Luxury Compact Sedans) rather than a brand or specific carline (example: Mercedes-Benz C-Class). Using the technologies and techniques developed in political microtargeting, HaystaqDNA can instead create specific targeting models for individual products. This is accomplished by ingesting existing customer data, augmenting it with original survey research, and using advanced data analytic methods find the individuals most likely to purchase the target product. The conquest targeting provided by HaystaqDNA is specific not only to a given brand, but also to a given car line. We rank every single consumer (~260M individuals) on their likelihood of buying that specific car. Our modeling methods go far past basic demographics and use over 1,000 distinct indicators to find our conquest targets. This technique is far more accurate than relying solely on age/gender/income/location based targets. Below is a case study of how a leading Luxury Automotive Brand used HaystaqDNA Automotive Microtargeting Engine to improve its conquest campaign results.
Like most automotive OEMs, our client traditionally bought lists for direct mail and email campaigns from commercial vendors. The brand was consistently delivering year over year sales growth thanks to regular significant new product introductions and excellent customer loyalty, but they understood they needed to dramatically increase conquest sales (automobile buyers who do not currently own a product from that brand) in order to achieve their future growth targets. They also required an easy to use interface to allow marketing staff across the organization to create and utilize lists of conquest customers. Based on HaystaqDNA’s success over several automotive pilot projects, the brand joined in partnership with HaystaqDNA to create and run the Automotive Microtargeting Engine (AME) in the fall of 2014.
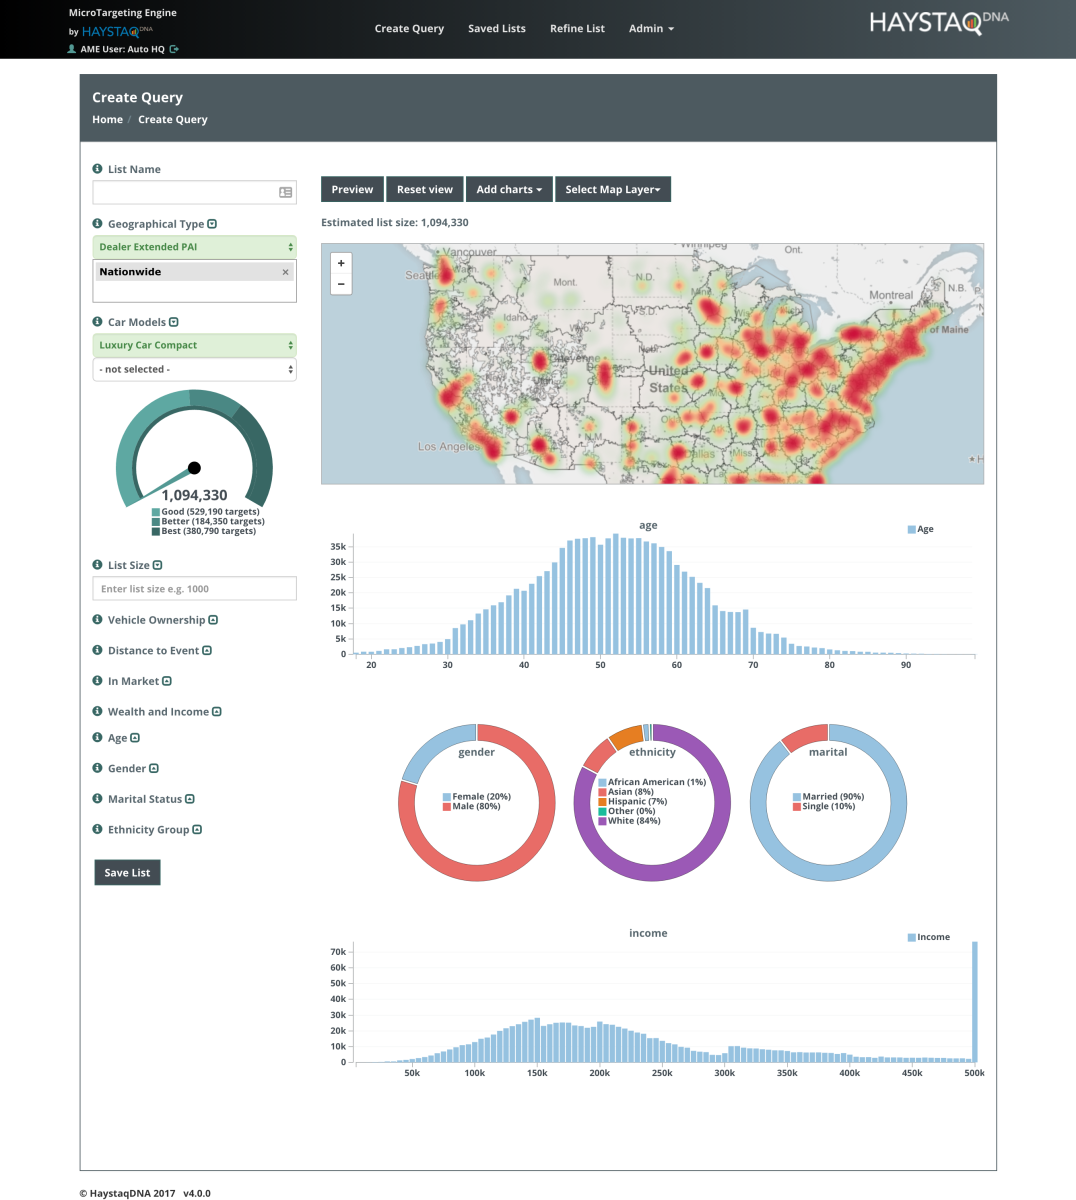
A screenshot of HaystaqDNA’s AME Interface..
The AME project consisted of the following parts:
- Setting up and receiving recurring feeds from the brand’s internal CRM system.
- Matching existing customers to a commercial database.
- Surveying new car buyers.
- Using Machine Learning Algorithms to model likely buyers and their preferences.
- QA and Validation of these models
- Scoring every individual in the country.
- Matching in vehicle ownership and in-market timing data.
- Creating an interface for marketers to identify, explore and pull conquest targets.
- Recurring Feeds: HaystaqDNA worked with the company’s IT department to receive recurring sales, dealer territory, dealer service, accessories, options and event attendance feeds. In the future Haystaq anticipates receiving additional feeds on inventory levels, inventory pipelines and financing received. These feeds come in across secure channels into a firewalled Amazon AWS cloud environment where they are cleaned and formatted. The data is all related back to itself via customer ids, vehicle ids and dealer ids.
- Consumer File: On behalf of the client, HaystaqDNA licensed the national infoGroup consumer file, consisting of roughly 260M US adult consumers. This file contains all of the Personally Identifying Information (PII) as well as over 1200 fields of additional data — Census Data, Property Data, Survey Data, Modeled Data and aggregated data bought from sources like magazines, retailers, airlines, hotels, insurance companies, financial institutions, etc. All of this data is converted to ‘indicator’ or ‘independent variable’ form where text fields are converted to binary flags and false numeric data is discarded. The historical brand sales data is then matched to this file using the PII in both.
- Surveys: Several times each year, HaystaqDNA conducts a survey of likely car buyers to find things like preferences for particular powertrains and lifestyle choices (like sports attendance and participation). These surveys and primarily conducted through IVR calls to landlines and live calls to cell phones, with online panels and SMS surveys used to supplement where needed.
- Dependent Variables and Modeling: Both the Customer and the Survey data is then transformed into ‘dependent variables’ or ‘DVs’. For example, for a specific car dependent variable, a person who is known to have bought said vehicle will be given a value of 1, while another who did not, will be given a value of 0. For a skiing DV, a survey respondent who indicates that they enjoy skiing will be given a value of 1 and another who answered that they never ski will be given a 0. Using our AWS infrastructure, we bring in both our data sets of DVs along with our massive table of independent variables. We have also found that people’s buying behaviors differ regionally, so we typically divide the US into four regions — Northeast, Southeast, Central and Western and model the DVs for each region independently. We use Python (and its SciKit-Learn and Pandas libraries) to model these dependent variables. We use a variety of algorithms (Logistic Regression, Decision Trees, Nearest Neighbor, Neural Networks, etc.) depending on the data sets, but we rely most heavily on the Logistic Regression and Decision Tree algorithms. We often blend the results of multiple models as we find that in doing this we often amplify the underlying signal and cancel out the noise. No one coefficient will determine a person’s score, our typical models will use in excess of 100 coefficients.
- Quality Assurance and Model Validation: We always withhold 1/3rd of the DVs to serve as a clean test set and we validate all models against this set. Using this test set we know what the model would predict for these individuals and we can compare that to their actual behavior (their car ownership or survey answers).
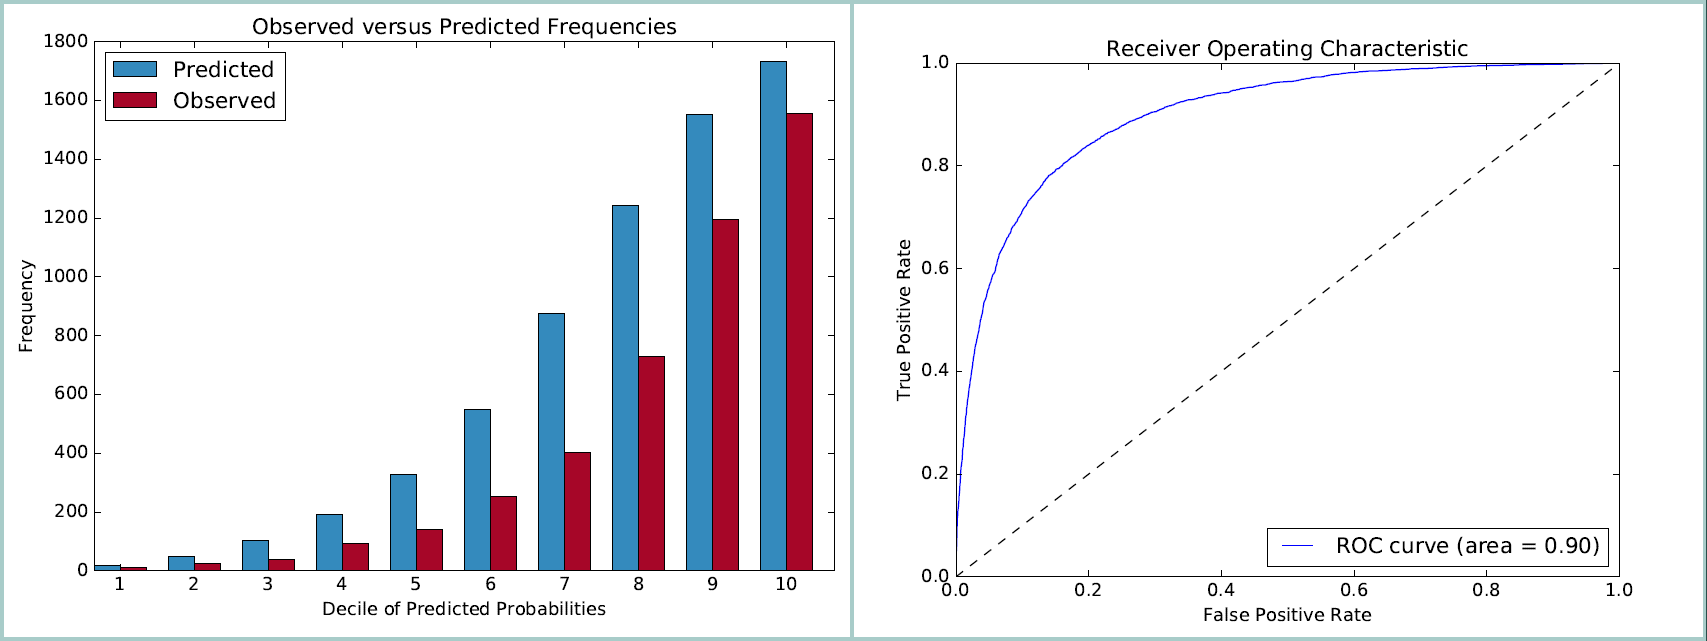
An example of two of our QA checks against the test sample — a Hosmer-Lemeshow step chart and a Receiver Operating Characteristic chart are featured above..
We also use visual tools to see how the different models correlate to one another.
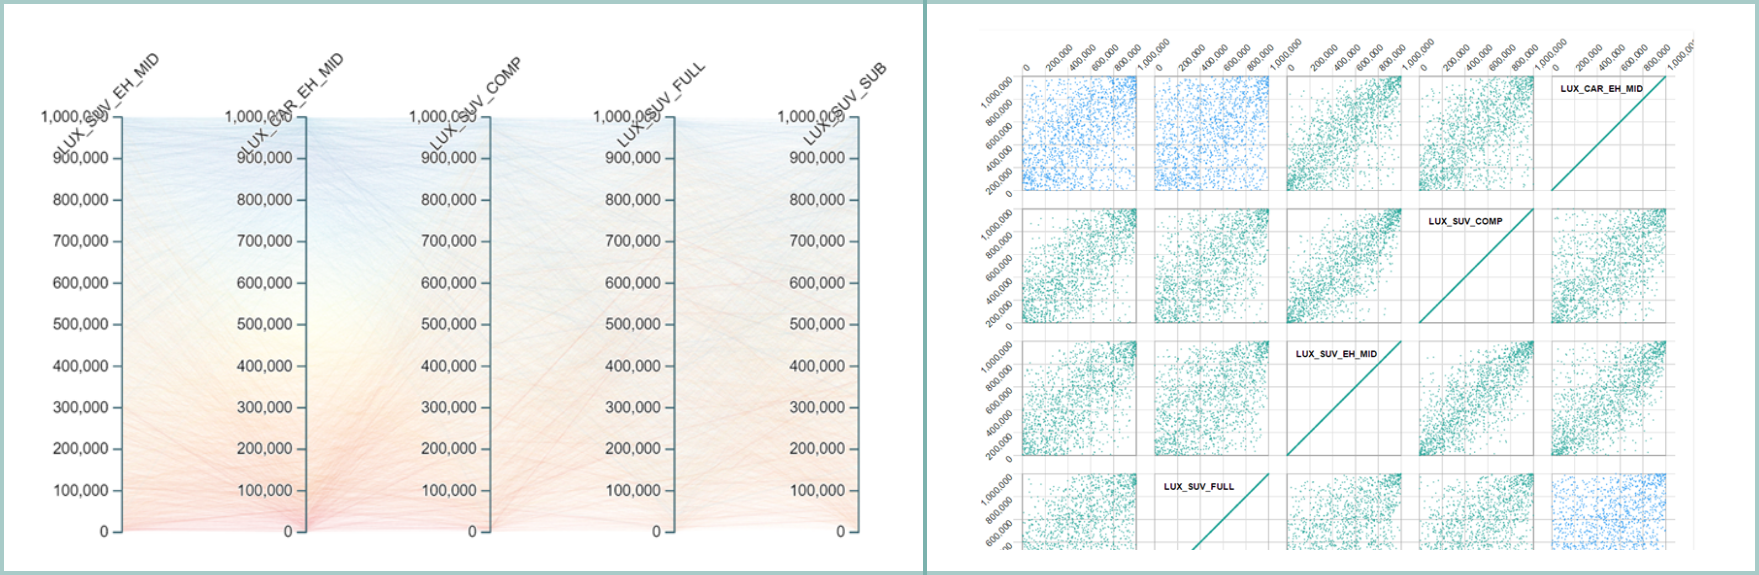
This visualization takes a sample of people and looks at their scores across a number of vehicle segments. We expect there to be a high correlation between models at similar price points and some derivations where the price points are car types are very different. Here we see the Luxury Midsize Hybrid SUV and Luxury Compact SUV scores highly correlate while the Luxury Midsize Hybrid Sedan and Luxury Full-Size SUV scores do not correlate..
At this point, the models also provide either coefficient weights or indicator importance ranks which allows us to see the attributes of individuals who score highly. We often report these attributes back to the client so they can gain insight into their customers.
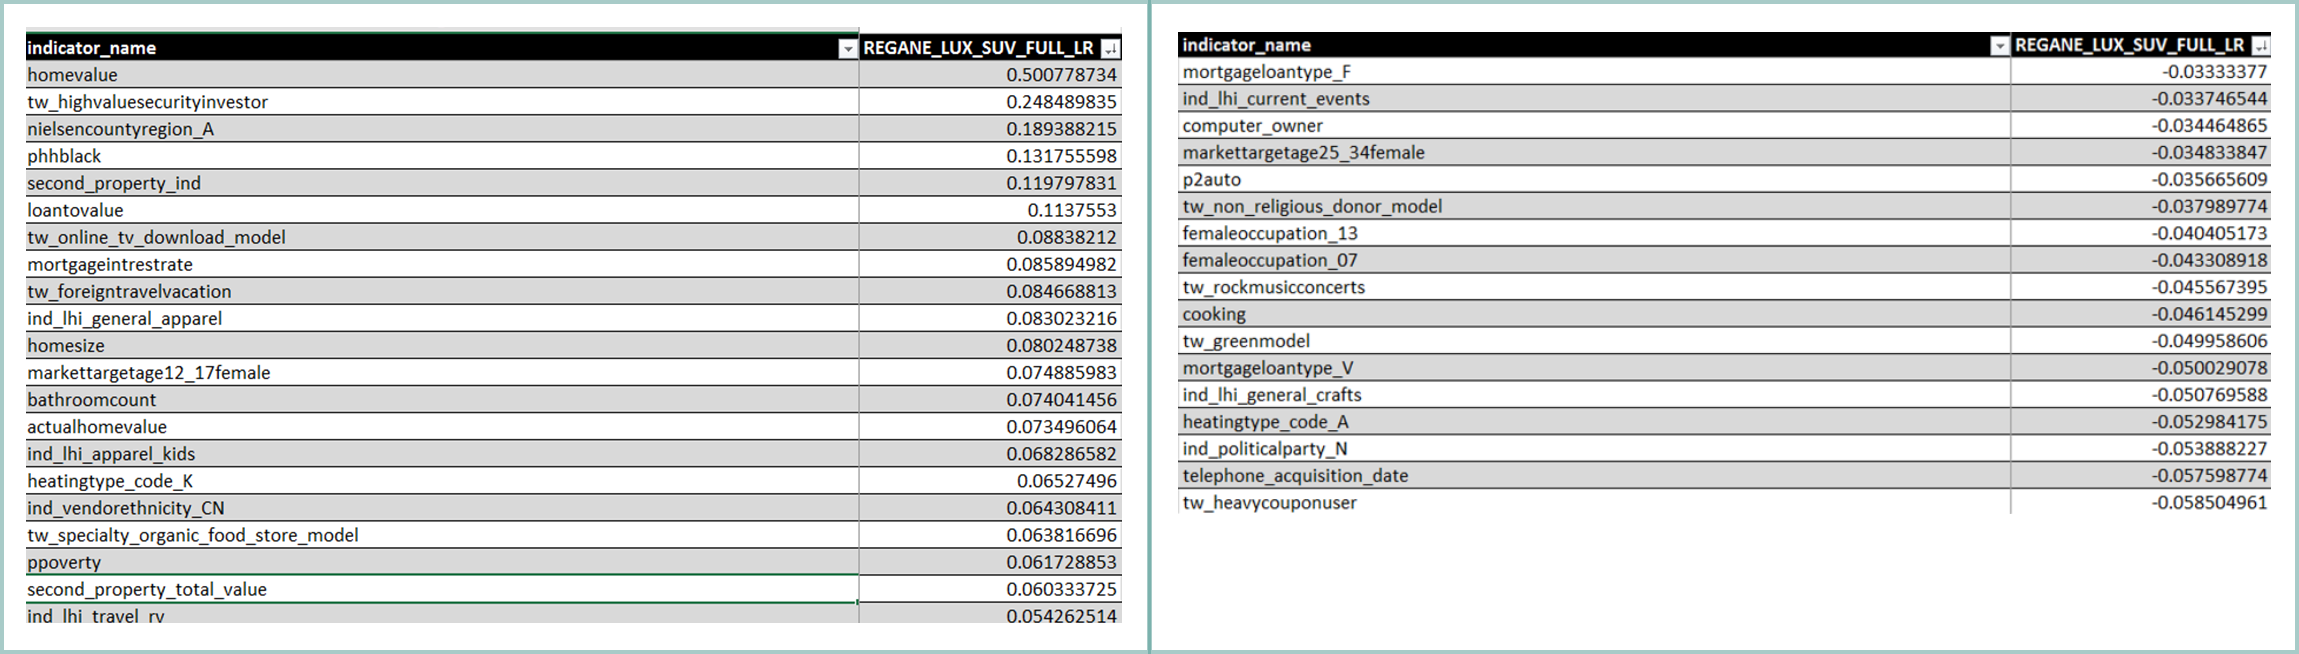
Some examples of recent positive and negative coefficients from a Full-sized Luxury SUV Model..
- Scoring: Once the best validated models are selected, our analysts set up a cluster environment on AWS. We use the Python models produced in the modeling phase, but we rely on Spark and Parquet to help us take advantage of the clustered environment. We can assign a score for every car line and lifestyle filter to every individual in a region and ultimately the country in a couple of hours. By default, our scores come out as a value between 0 and 1, but we convert these scores to a rank ordering of individuals within each region.
- Vehicle Ownership and In-Market Timing Data: Once we have our consumer file scored and ranked, we match in garage and auto intender data from the client’s chosen vendor. The garage data consists of over 168M individual vehicles that are or have been owned by over 110M individuals. Additionally, this vendor provides a database of Auto Intenders — an in-market timing file which indicates individuals likely to buy a car within the next three, six, or twelve months. This file usually consists of 10M-12M individuals. Both the garage data and in market timing data become filters in the AME Interface.
- The AME Interface: The client needed these conquest targets to be available to marketers at multiple levels (National staff – both brand and agency, Regional offices, and individual Dealers) for both exploration and list pulling, so HaystaqDNA created the Automotive Microtargeting Engine. This interface allows marketers to specify a geography (dealers are limited to their own boundaries), specify which car line or car lines they are interested in marketing, filter by different lifestyle, car preference, demographic or market timing filters, indicate the desired list size and optionally put in a distance from event limiter.

A screenshot of HaystaqDNA’s AME Interface..
In addition to creating a list query, Marketers can merge lists or exclude previously created lists and they can assign individuals in a list to specific car lines/collateral. The target channel for the lists can also be specified by a number of templates — AME lists have been used for direct mail, email and digital outreach.
Using this interface, marketers can explore their target areas in real time and pull lists in near real time, greatly shortening the time to deployment vs. what the client had experienced with traditional list providers.
Results: The client has continually tested AME against its traditional list providers. Time and again AME has achieved better campaign conversion. A recent test showed AME with 50-80% higher conversion (depending on the specific car line). The targeting cost per sale also halved. In experiments with addressable TV, Haystaq has seen a 70% higher conversion rate on automotive vs. tests with a leading addressable TV vendor.