
Edition 01
WHAT’S NEW: We’ve updated our website! Cool graphics, cooler products, coolest team behind it. Check it out here.
There’s a difference between a campaign’s biggest fans and biggest targets. Walk with me.
A fan is enthusiastic, caring, and is willing to volunteer for a cause that they care about. They’re going to engage with the campaign’s Twitter account and wear the t-shirts. This usually represents the core of a campaign’s base.
The next layer in this campaign onion is the traditional voter. This represents the vast majority of Americans. Maybe they don’t read headlines, maybe some of them claim to “not be into politics,” but for better or worse, most of these people are going to reliably vote for the same party every time.
Finally, there’s the remaining bunch. These voters are more likely to change with the tides of the political season, vote for both sides of the aisle, and have overall few party loyalties. When the status quo isn’t working for them, they vote against it. And with skyrocketing gas prices, an affordability crisis, and domestic and international conflict, the status quo is looking pretty unappetizing for a lot of voters.
So how do we find these voters? That’s where Haystaq models come in: by leveraging annual survey data, machine learning, and political analytics, we’ve built finely-tuned models predicting where individual voters fall on dozens of issues. Let’s take a closer look at two models that will help us find these persuadable needles in our America-sized haystack.
Our GOP ideology score, which ranges from 0 (a staunchly progressive voter) to 100 (a right-wing poster child), helps us find folks across the political spectrum. Averaging this score by county paints a picture that election returns may gloss over. For comparison, we’ve included aggregate 2016-2024 election results from Ballotpedia, along with our GOP ideology scores averaged by county. Click here or on the map below to explore, and take a look at how apparently red-leaning counties, from the Texas-Mexico border to the rural inland counties of Washington and California, have surprisingly left-leaning ideological centers.
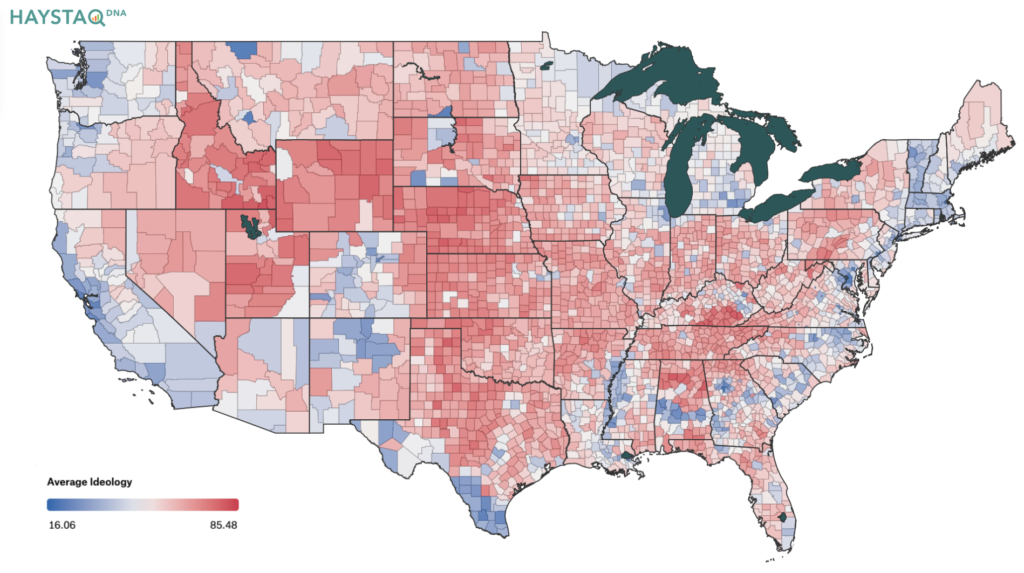
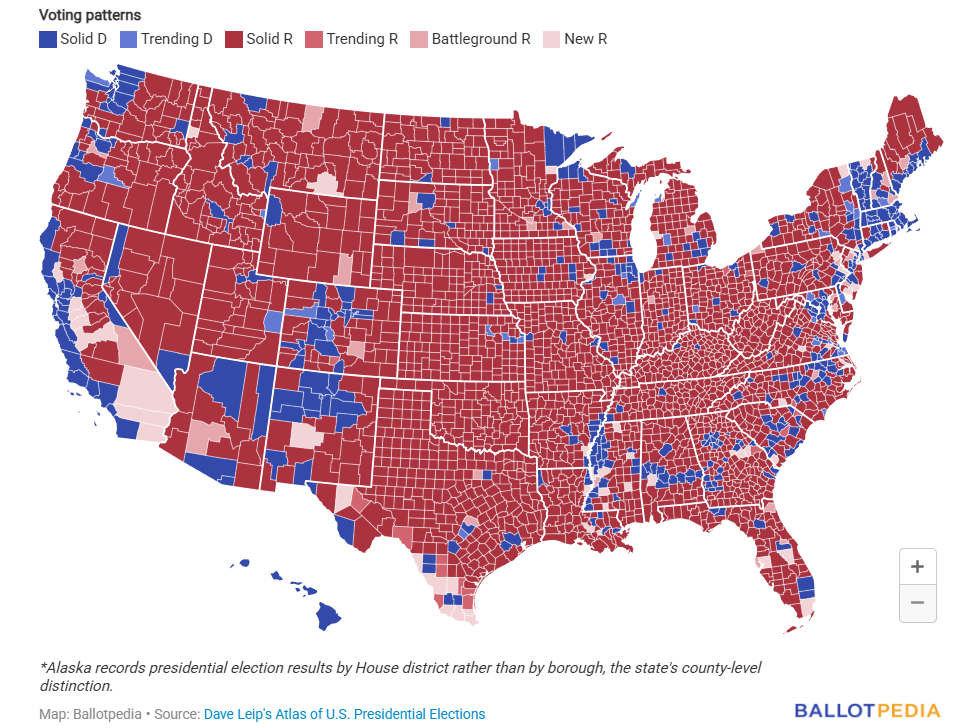
Image: The top image shows a map of the average Haystaq ideology scores across voters by county. Compared to a map of election results in recent years (bottom image)… doesn’t the first map seem a little bluer? (Hint: click on the first image for an even better view!)
To find an even more elusive demographic — moderate Republicans who might actually vote Democratic in some elections — we’ve mapped scores from our ticket-splitting model alongside our ideology scores. The map below shows the percentage of likely Republicans who are both moderates and highly likely to ticket-split, with the highest percentages in yellow. Click here or on the map below for a better look!
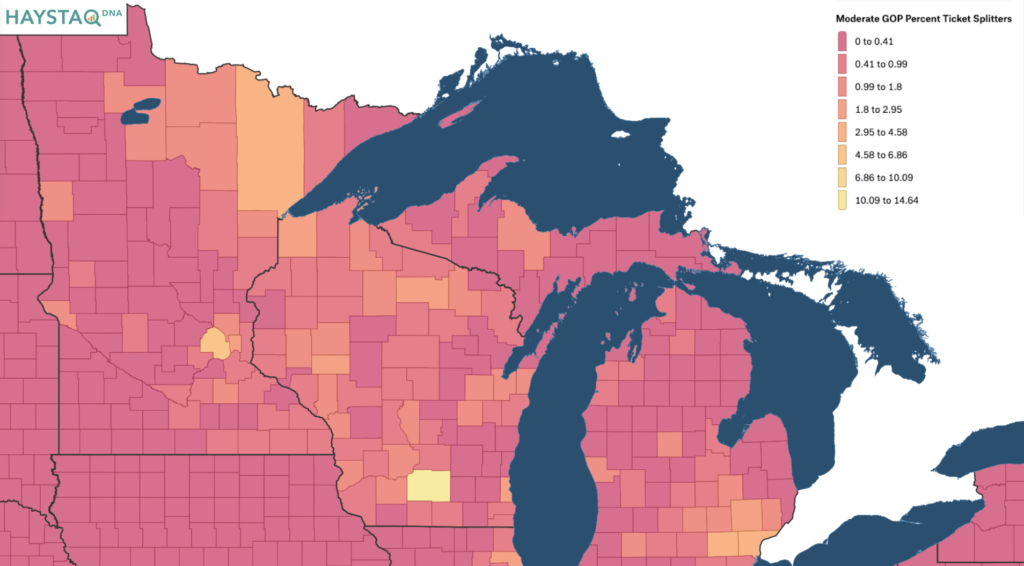
Image: The image above shows a map of the percentage of likely Republicans who are both moderates and modeled as highly likely to ticket-split by county within hotspot states Minnesota, Michigan, and Wisconsin.
A hotspot for moderate ticket-splitting Republicans emerges in the battleground states of the upper Midwest; for example, where the Republican swing vote percentage hovers around 1 percent for most counties, 14 percent of the 125,000 likely Republicans in Madison are predicted to be highly likely to occasionally cast their vote for a Democrat. With key congressional races and battles for control of state governments in Minnesota, Wisconsin, and Michigan, getting the support of a handful of swing voters could be the difference between victory and defeat.
These are just two of the many models we can leverage to help you identify voters that are the best use of your valuable resources. With hundreds of issues (literally) floating around your campaign, knowing who your campaign’s targets are is the key to finding the needle in the Haystaq and ensuring a successful campaign trail.
Have questions or want to talk strategy?
Call us at 202-548-2562
We’d love to help you put these insights to work.
Track the evolving political landscape with insights delivered straight to your inbox


Copyright (C) 2026 HaystaqDNA. All rights reserved.
Our mailing address is:
Haystaq DNA
1328 Florida Avenue NW 2nd Floor
Washington, DC 20009
Leave a Reply