Download a PDF of the Case Study
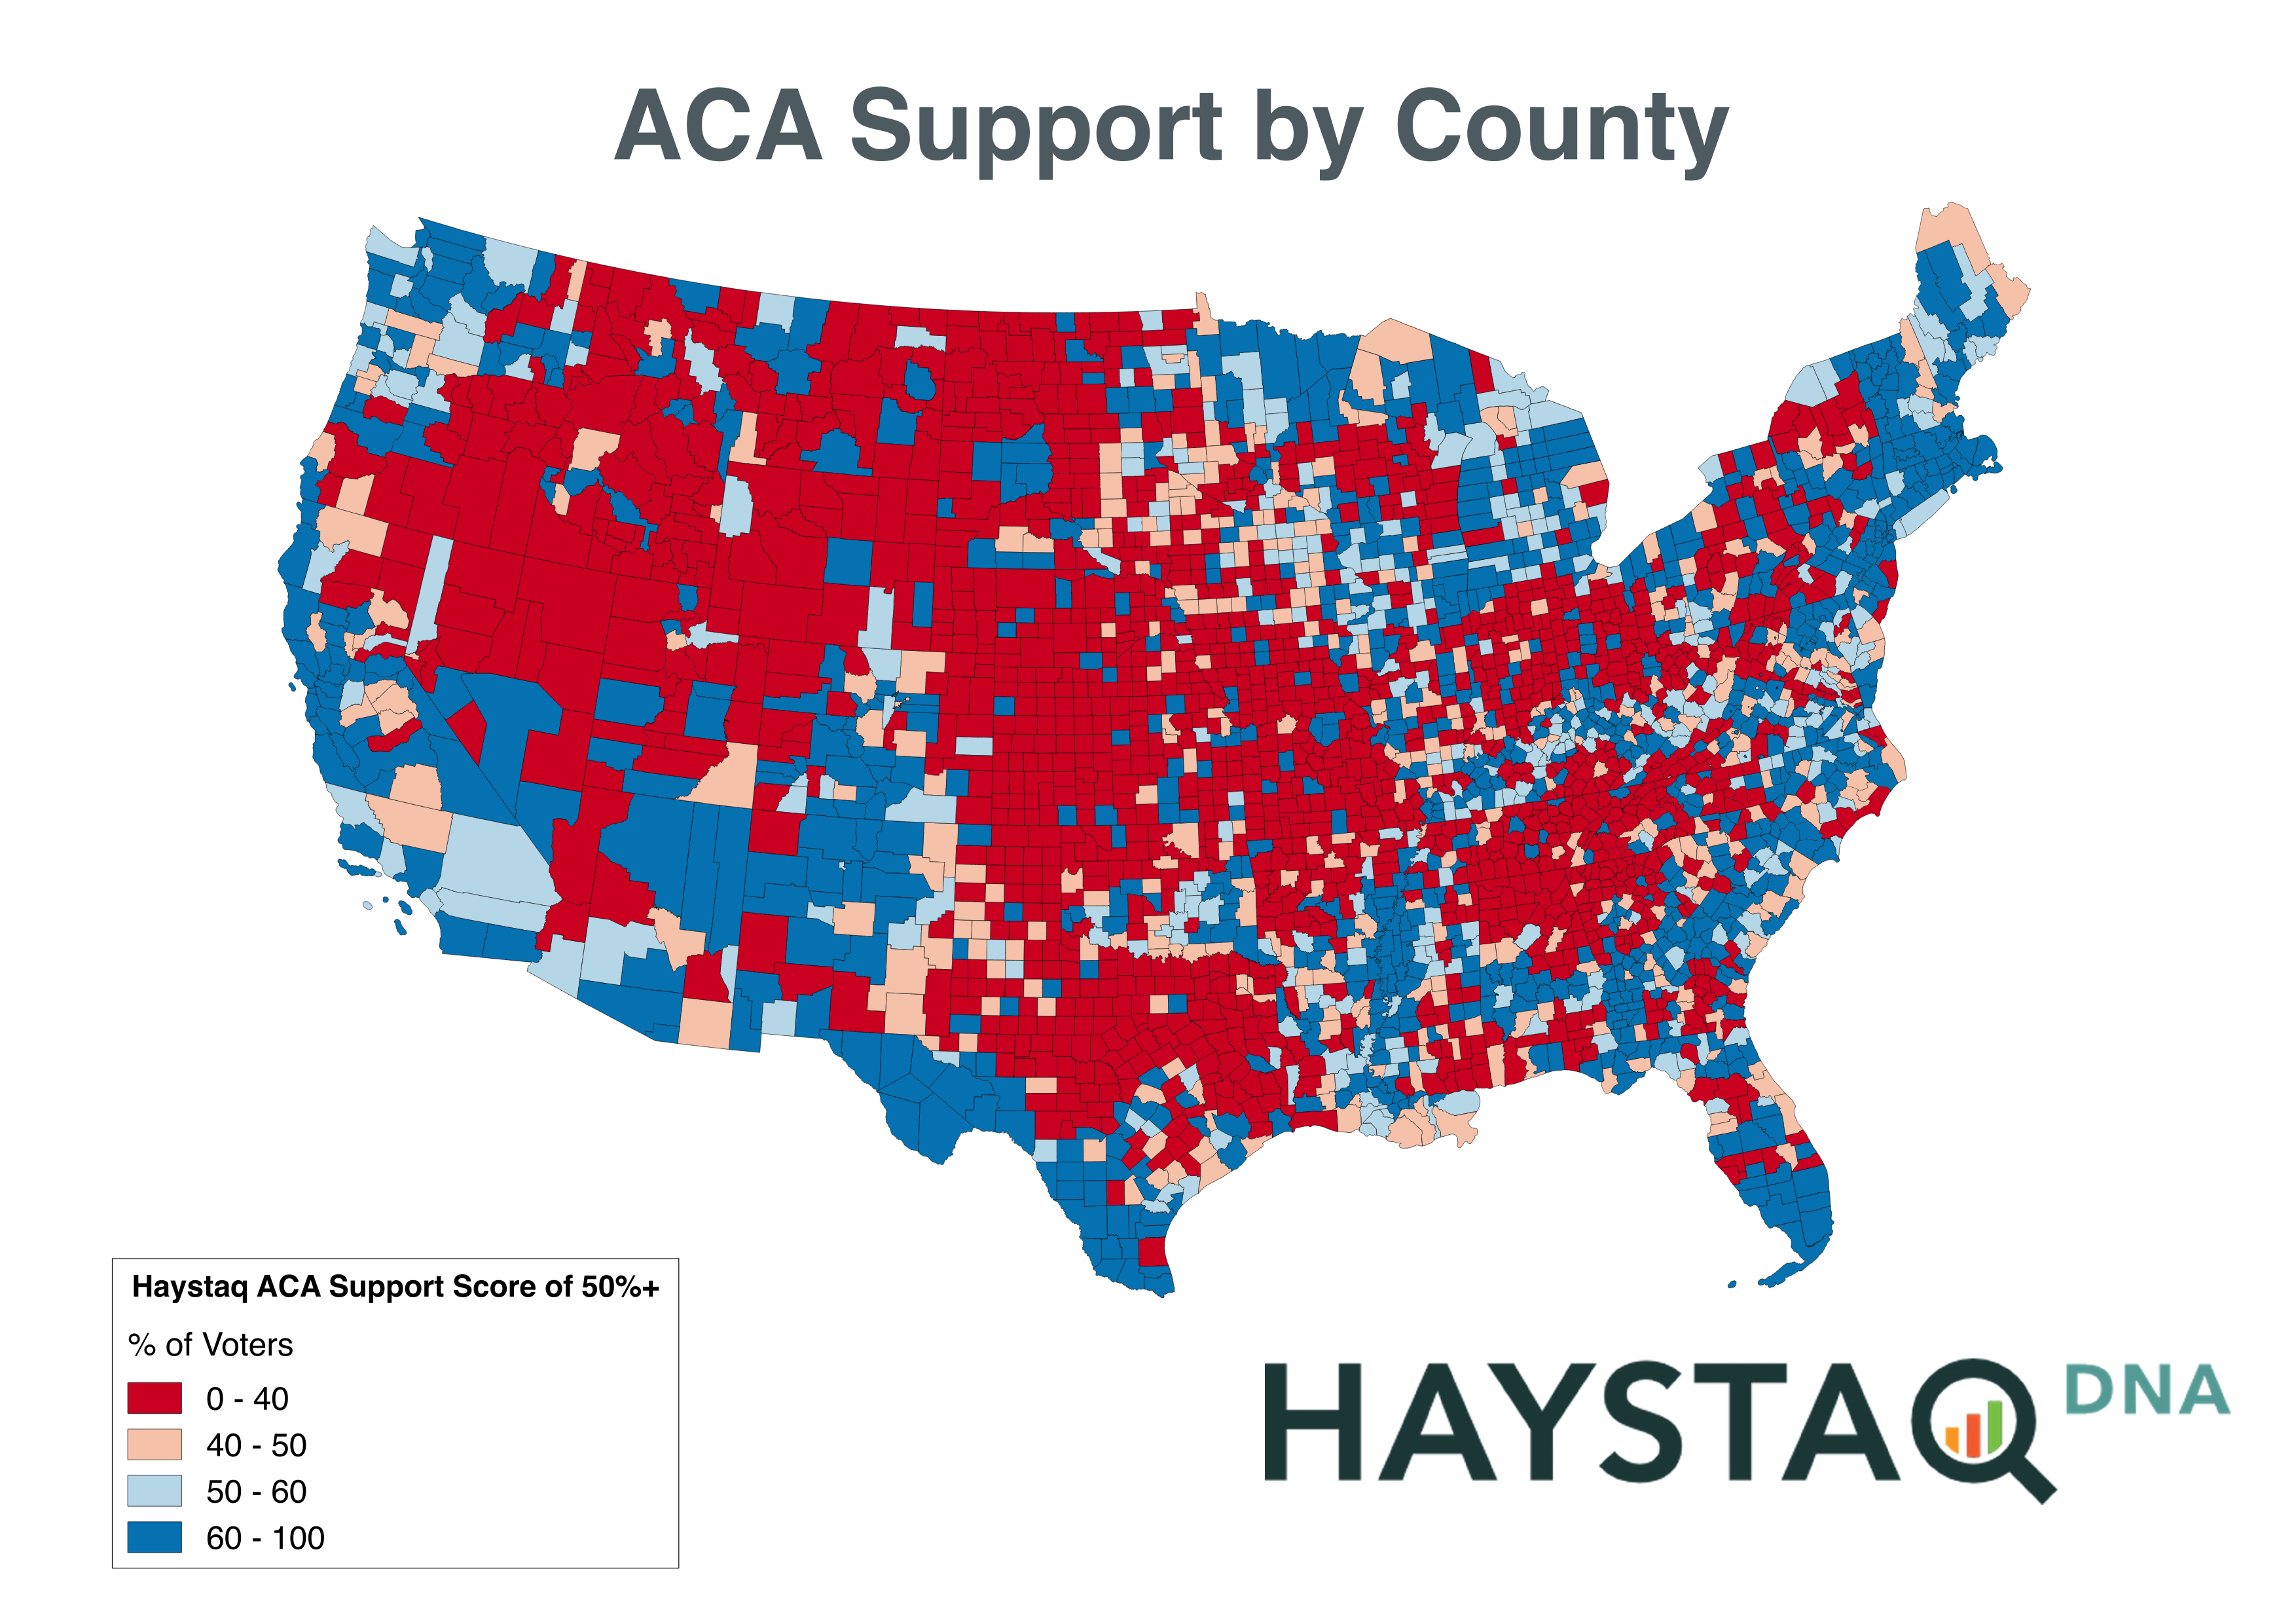
As the new Congress rushes towards a repeal of the Affordable Care Act, many are working against the opinion of the voters in their own districts. Research conducted by HaystaqDNA during the 2016 campaign showed that a majority of Americans support the ACA. However, members of Congress are more concerned with opinions of their constituents than they are with national numbers. Therefore, Haystaq looked at support levels by Congressional District. 253 of 435 or 58% of Congressional Districts show a majority of voters supporting ACA.
Not surprisingly, the majority of these pro-ACA districts are held by Democrats. However, 61 pro-ACA districts are currently held by Republicans. Many of these districts are relatively safely Republican, but in many, the difference in support in favor of the ACA is near or above the margin of victory in the 2016 election. This would suggest that voting to repeal the act puts these candidates at risk next year, even more so once voters realize how they will be personally affected by a repeal of the ACA.
The Haystaq microtargeting models have identified 98,942,762 likely ACA supporters nationwide, 41,697,492 of whom live in Republican districts.
METHODOLOGY
These numbers are based on a national survey of approximately 10,000 registered voters. The survey responses were used to build microtargeting models predicting how any individual voter would have an- swered the question had they been surveyed. The Congressional District percent in support of ACA is based on the number of voters in each district with an ACA support score of 50% or higher. The ACA support score predicts the likelihood that a voter would say that they support the ACA if surveyed. These numbers differ from poll results in that they are not weighted. A poll is likely to be weighted based on assumptions about likely turnout. The Haystaq models are applied to every registered voter.
The microtargeting models were built using a combination of the survey results and nearly 1,000 fields of commercial marketing data, Census demographics and proprietary derived indicators. Haystaq combines a variety of statistical and machine learning algorithms including Penalized Logistic Regression and Random Forests. The predictive models were validated against a hold-out sample to confirm that they accurately predicted the likely survey responses of individuals whose responses were not used in building the models.
Following is the question wording used in the survey:
Which comes closest to your opinion on the Affordable Care Act or Obamacare: that it is beneficial but doesn’t go far enough, that it is about right, or that it goes too far and should be repealed? Please press 1 if you think Obamacare is beneficial but doesn’t go far enough, press 2 if you like the law as it is, press 3 if you think Obamacare goes too far and should be repealed, or press 4 if you are not sure.
The model predicts the likelihood that a voter with an opinion on ACA would select option 1 (Support ACA but thinks it doesn’t go far enough) or option 2 (like the law as it is) vs. 3 (Goes too far and should be repealed). Because the model is predicting support only among those with an opinion, respondents picking option 4 (unsure) are not included.
The survey was conducted using a combination of live and IVR (automated phone calls) to a random sample of more than 10,000 voters nationwide.
| CD | Name | % of Vote in 2016 Election | % of Voters Supporting ACA |
|---|---|---|---|
| TX23 | Will Hurd | 50.90% | 72.40% |
| NY11 | Daniel Donovan | 63.30% | 70.40% |
| FL27 | Ileana Ros-Lehtinen | 54.90% | 67.20% |
| FL26 | Carlos Curbelo | 56.30% | 65.30% |
| WA8 | Dave Reichert | 60.00% | 64.90% |
| CA21 | David G. Valadao | 93.20% | 63.80% |
| IL12 | Mike Bost | 57.80% | 63.30% |
| MI11 | David Trott | 56.90% | 61.40% |
| VA10 | Barbara Comstock | 52.90% | 61.00% |
| KY6 | Andy Barr | 61.10% | 60.60% |
| IL13 | Rodney Davis | 59.70% | 60.50% |
| NJ11 | Rodney Frelinghuysen | 60.00% | 60.40% |
| NJ7 | Leonard Lance | 55.70% | 59.50% |
| VA2 | Scott Taylor | 61.70% | 59.10% |
| MI8 | Mike Bishop | 58.80% | 58.60% |
| IL6 | Peter J. Roskam | 59.50% | 58.40% |
| FL18 | Brian Mast | 55.50% | 58.10% |
| NM2 | Steve Pearce | 62.80% | 57.90% |
| FL25 | Mario Diaz-Balart | 62.40% | 57.90% |
| MI6 | Fred Upton | 61.70% | 57.60% |
| CA25 | Stephen Knight | 54.20% | 57.50% |
| CO6 | Mike Coffman | 54.70% | 56.70% |
| FL2 | Neal Dunn | 69.20% | 56.40% |
| NY24 | John Katko | 61.00% | 55.70% |
| NY19 | John Faso | 54.70% | 55.60% |
| AZ2 | Martha McSally | 56.70% | 54.80% |
| CA39 | Edward Royce | 57.70% | 54.60% |
| MI7 | Tim Walberg | 57.90% | 54.60% |
| MI1 | Jack Bergman | 58.20% | 54.60% |
| PA15 | Charles W. Dent | 60.60% | 54.30% |
| PA18 | Tim Murphy | 100.00% | 54.20% |
| PA8 | Brian Fitzpatrick | 54.50% | 54.10% |
| IL14 | Randy Hultgren | 59.60% | 54.10% |
| MI4 | John Moolenaar | 65.80% | 54.00% |
| IA1 | Rod Blum | 53.90% | 53.90% |
| WA5 | Cathy McMorris Rodgers | 59.50% | 53.90% |
| TX32 | Pete Sessions | 100.00% | 53.90% |
| NJ3 | Tom MacArthur | 60.60% | 53.70% |
| WA3 | Jaime Herrera Beutler | 61.40% | 53.60% |
| NJ4 | Chris Smith | 65.50% | 53.60% |
| NJ2 | Frank LoBiondo | 61.60% | 53.60% |
| MN3 | Erik Paulsen | 56.90% | 53.60% |
| PA12 | Keith Rothfus | 61.90% | 53.50% |
| KY1 | James Comer Jr. | 71.20% | 53.30% |
| MI3 | Justin Amash | 61.30% | 53.00% |
| ME2 | Bruce Poliquin | 54.90% | 52.70% |
| GA6 | Tom Price | 61.60% | 52.30% |
| VA5 | Thomas Garrett | 58.30% | 52.10% |
| TX27 | Blake Farenthold | 58.90% | 52.10% |
| LA4 | Mike Johnson | 65.20% | 52.00% |
| NY2 | Peter T. King | 62.40% | 51.90% |
| LA5 | Ralph Abraham | 100.00% | 51.80% |
| TX7 | John Culberson | 56.20% | 51.70% |
| NC13 | Ted Budd | 56.10% | 51.50% |
| CA49 | Darrell Issa | 51.00% | 51.40% |
| NY1 | Lee Zeldin | 59.00% | 51.40% |
| PA6 | Ryan Costello | 57.30% | 51.20% |
| FL15 | Dennis A. Ross | 57.50% | 51.10% |
| OH14 | David Joyce | 62.70% | 51.10% |
| GA12 | Rick Allen | 61.60% | 50.70% |
| OH1 | Steve Chabot | 59.60% | 50.40% |